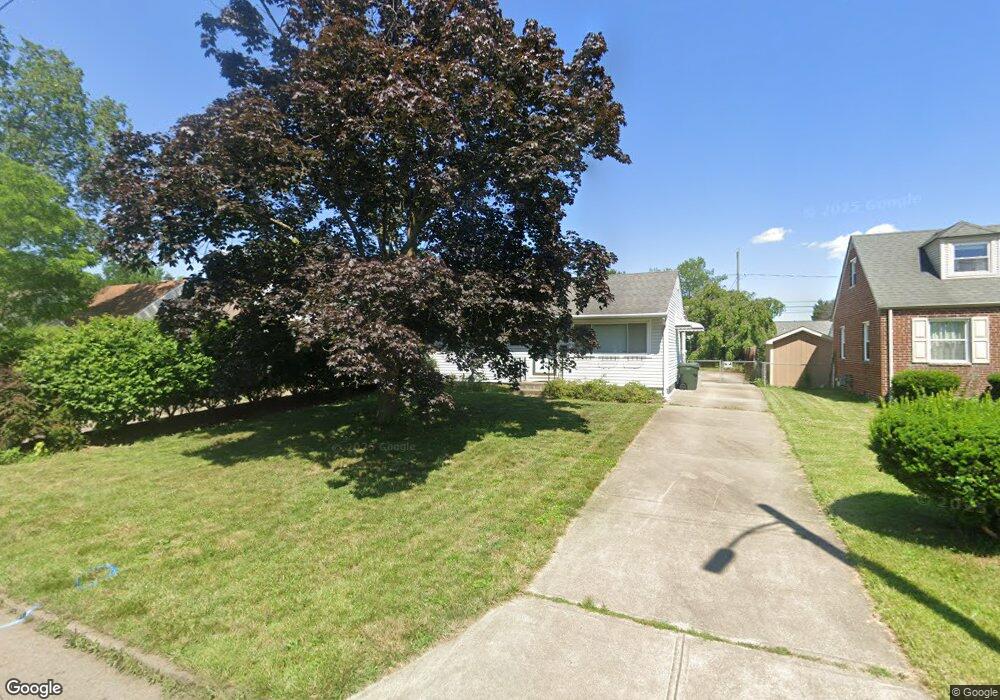
3080 Oaklawn St Columbus, OH 43224
North Linden NeighborhoodEstimated Value: $218,000 - $261,000
3
Beds
2
Baths
1,073
Sq Ft
$220/Sq Ft
Est. Value
About This Home
This home is located at 3080 Oaklawn St, Columbus, OH 43224 and is currently estimated at $236,430, approximately $220 per square foot. 3080 Oaklawn St is a home located in Franklin County with nearby schools including Huy Elementary School, Medina Middle School, and Mifflin High School.
Ownership History
Date
Name
Owned For
Owner Type
Purchase Details
Closed on
Mar 7, 2018
Sold by
Beeble William J
Bought by
Weber Wesley A
Current Estimated Value
Home Financials for this Owner
Home Financials are based on the most recent Mortgage that was taken out on this home.
Original Mortgage
$88,000
Outstanding Balance
$75,121
Interest Rate
4.22%
Mortgage Type
New Conventional
Estimated Equity
$161,309
Purchase Details
Closed on
Feb 22, 2011
Sold by
Pugh Maria R and Zeman Nicholas D
Bought by
Beeble William J
Home Financials for this Owner
Home Financials are based on the most recent Mortgage that was taken out on this home.
Original Mortgage
$110,622
Interest Rate
4.75%
Mortgage Type
FHA
Purchase Details
Closed on
Aug 22, 2006
Sold by
Kelley Charles and Kelley Mary C
Bought by
Zeman Nicholas D and Pugh Maria R
Home Financials for this Owner
Home Financials are based on the most recent Mortgage that was taken out on this home.
Original Mortgage
$112,400
Interest Rate
6.78%
Mortgage Type
Purchase Money Mortgage
Create a Home Valuation Report for This Property
The Home Valuation Report is an in-depth analysis detailing your home's value as well as a comparison with similar homes in the area
Home Values in the Area
Average Home Value in this Area
Purchase History
| Date | Buyer | Sale Price | Title Company |
|---|---|---|---|
| Weber Wesley A | $110,000 | Apex Title Agency Ltd | |
| Beeble William J | $113,500 | Worthington | |
| Zeman Nicholas D | $115,900 | Worthington |
Source: Public Records
Mortgage History
| Date | Status | Borrower | Loan Amount |
|---|---|---|---|
| Open | Weber Wesley A | $88,000 | |
| Previous Owner | Beeble William J | $110,622 | |
| Previous Owner | Zeman Nicholas D | $112,400 |
Source: Public Records
Tax History Compared to Growth
Tax History
| Year | Tax Paid | Tax Assessment Tax Assessment Total Assessment is a certain percentage of the fair market value that is determined by local assessors to be the total taxable value of land and additions on the property. | Land | Improvement |
|---|---|---|---|---|
| 2024 | $2,903 | $64,690 | $15,580 | $49,110 |
| 2023 | $2,866 | $64,680 | $15,575 | $49,105 |
| 2022 | $1,937 | $37,350 | $8,540 | $28,810 |
| 2021 | $1,941 | $37,350 | $8,540 | $28,810 |
| 2020 | $1,943 | $37,350 | $8,540 | $28,810 |
| 2019 | $1,881 | $31,010 | $8,540 | $22,470 |
| 2018 | $1,844 | $31,010 | $8,540 | $22,470 |
| 2017 | $1,880 | $31,010 | $8,540 | $22,470 |
| 2016 | $1,994 | $30,100 | $5,670 | $24,430 |
| 2015 | $1,810 | $30,100 | $5,670 | $24,430 |
| 2014 | $1,814 | $30,100 | $5,670 | $24,430 |
| 2013 | $995 | $33,460 | $6,300 | $27,160 |
Source: Public Records
Map
Nearby Homes
- 3086 Bremen St
- 3058 Dresden St
- 1671 E Brighton Rd
- 3131 Dresden St
- 3049 Cleveland Ave
- 1711 Piedmont Rd
- 3134 Medina Ave
- 1841 E North Broadway St
- 3056 Medina Ave
- 1888 E North Broadway St
- 1794 Audrey Rd
- 1812 Audrey Rd
- 1729 Huy Rd
- 1944 E North Broadway St
- 2890 Medina Ave
- 1940 Eddystone Ave
- 1980 Oakland Park Ave
- 1853 E Lakeview Ave
- 2819 Norwood St
- 1591-1593 E Weber Rd
- 3072 Oaklawn St
- 3092 Oaklawn St
- 3071 Kenlawn St
- 3098 Oaklawn St
- 3060 Oaklawn St
- 3065 Kenlawn St
- 3077 Kenlawn St
- 3085 Kenlawn St
- 3079 Oaklawn St
- 3087 Oaklawn St
- 3073 Oaklawn St
- 3052 Oaklawn St
- 3106 Oaklawn St
- 3093 Oaklawn St
- 3051 Kenlawn St
- 3091 Kenlawn St
- 3101 Oaklawn St
- 3061 Oaklawn St
- 3045 Kenlawn St
- 3097 Kenlawn St