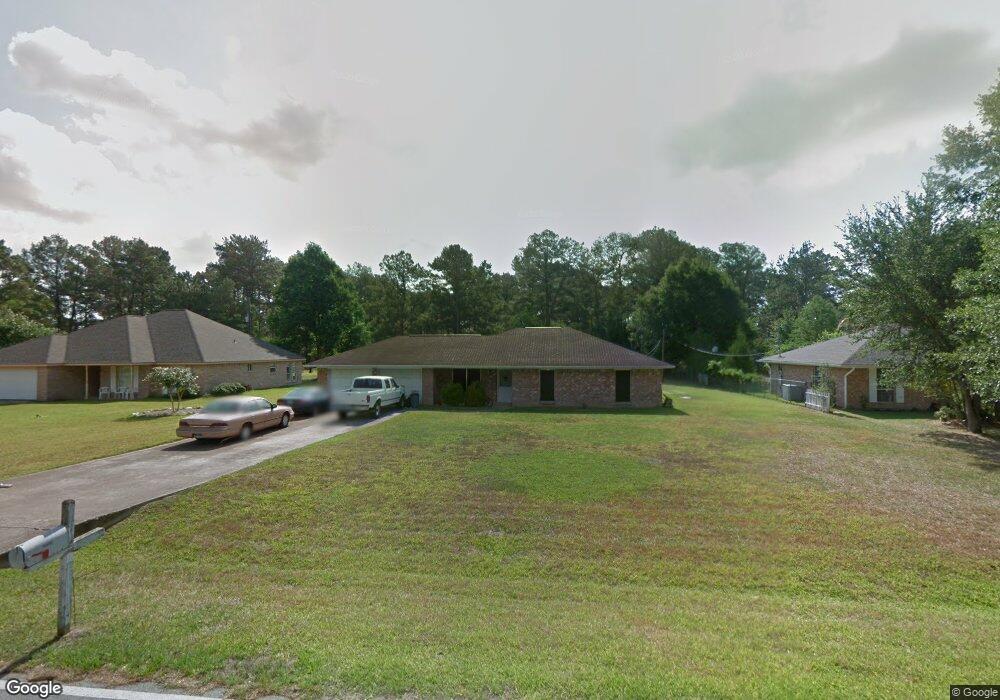
30806 Mckinney Dr Tomball, TX 77375
Hufsmith NeighborhoodEstimated Value: $308,949 - $359,000
3
Beds
2
Baths
1,732
Sq Ft
$194/Sq Ft
Est. Value
About This Home
This home is located at 30806 Mckinney Dr, Tomball, TX 77375 and is currently estimated at $336,737, approximately $194 per square foot. 30806 Mckinney Dr is a home located in Harris County with nearby schools including Tomball Elementary School, Tomball Intermediate School, and Tomball Junior High School.
Ownership History
Date
Name
Owned For
Owner Type
Purchase Details
Closed on
Nov 8, 2017
Sold by
Durow Bettie
Bought by
Durow Craig E
Current Estimated Value
Purchase Details
Closed on
Dec 31, 2015
Sold by
Breaux Michelle M
Bought by
Durow Charles E and Durow Bettie
Purchase Details
Closed on
Jan 6, 2015
Sold by
Raney Kyle Q
Bought by
Breaux Michelle M
Purchase Details
Closed on
Jun 12, 2012
Sold by
Moore Ann and Raney John Q
Bought by
Raney Matthew T and Raney Nathan K
Purchase Details
Closed on
Aug 6, 1999
Sold by
Rayburn Earl E
Bought by
Raney Kyle Q
Home Financials for this Owner
Home Financials are based on the most recent Mortgage that was taken out on this home.
Original Mortgage
$87,300
Interest Rate
7.63%
Create a Home Valuation Report for This Property
The Home Valuation Report is an in-depth analysis detailing your home's value as well as a comparison with similar homes in the area
Home Values in the Area
Average Home Value in this Area
Purchase History
| Date | Buyer | Sale Price | Title Company |
|---|---|---|---|
| Durow Craig E | -- | None Available | |
| Durow Charles E | -- | Stewart Title | |
| Breaux Michelle M | $120,000 | None Available | |
| Raney Matthew T | -- | None Available | |
| Moore Ann | -- | None Available | |
| Raney Kyle Q | -- | Texas American Title Company |
Source: Public Records
Mortgage History
| Date | Status | Borrower | Loan Amount |
|---|---|---|---|
| Previous Owner | Raney Kyle Q | $87,300 |
Source: Public Records
Tax History Compared to Growth
Tax History
| Year | Tax Paid | Tax Assessment Tax Assessment Total Assessment is a certain percentage of the fair market value that is determined by local assessors to be the total taxable value of land and additions on the property. | Land | Improvement |
|---|---|---|---|---|
| 2025 | $3,115 | $256,867 | $52,272 | $204,595 |
| 2024 | $3,115 | $259,400 | $52,272 | $207,128 |
| 2023 | $3,115 | $286,500 | $52,272 | $234,228 |
| 2022 | $3,897 | $286,500 | $52,272 | $234,228 |
| 2021 | $3,669 | $193,472 | $40,293 | $153,179 |
| 2020 | $3,447 | $161,633 | $27,225 | $134,408 |
| 2019 | $4,018 | $180,300 | $27,225 | $153,075 |
| 2018 | $2,081 | $181,628 | $27,225 | $154,403 |
| 2017 | $3,842 | $172,677 | $27,225 | $145,452 |
| 2016 | $3,842 | $172,677 | $27,225 | $145,452 |
| 2015 | $2,978 | $132,209 | $27,225 | $104,984 |
| 2014 | $2,978 | $132,209 | $27,225 | $104,984 |
Source: Public Records
Map
Nearby Homes
- 13303 Lost Creek Rd
- 31414 Helen Ln
- 12614 Fort Isabella Dr
- 12510 Sherborne Castle Ct
- 12806 Durham Creek Ln
- 12122 Zion Rd
- 31134 Gullwing Manor Dr
- 31218 Gullwing Manor Dr
- 31106 Gullwing Manor Dr
- 31211 Raleigh Creek Dr
- 803 Junction Point Ln
- 1323 E Hufsmith Rd
- 1046 Bending Trail Dr
- 1107 Grand Junction Dr
- 24102 Flax Ct
- 1123 Magnolia Branch Ln
- 25010 Butler Hill Ct
- 12118 S Tara Plantation Dr
- 1302 Pine Trail
- 25003 Tarlton Ct
- 30810 Mckinney Dr
- 30802 Mckinney Dr
- 30718 Mckinney Dr
- 30814 Mckinney Dr
- 30807 Mckinney Dr
- 30803 Mckinney Dr
- 30811 Mckinney Dr
- 30714 Mckinney Dr
- 30719 Mckinney Dr
- 30815 Mckinney Dr
- 30710 Mckinney Dr
- 30715 Mckinney Dr
- 12927 Mossy Shore Dr
- 30711 Mckinney Dr
- 30706 Mckinney Dr
- 30707 Mckinney Dr
- 12919 Mossy Shore Dr
- 30702 Mckinney Dr
- 30703 Mckinney Dr
- 30618 Mckinney Dr