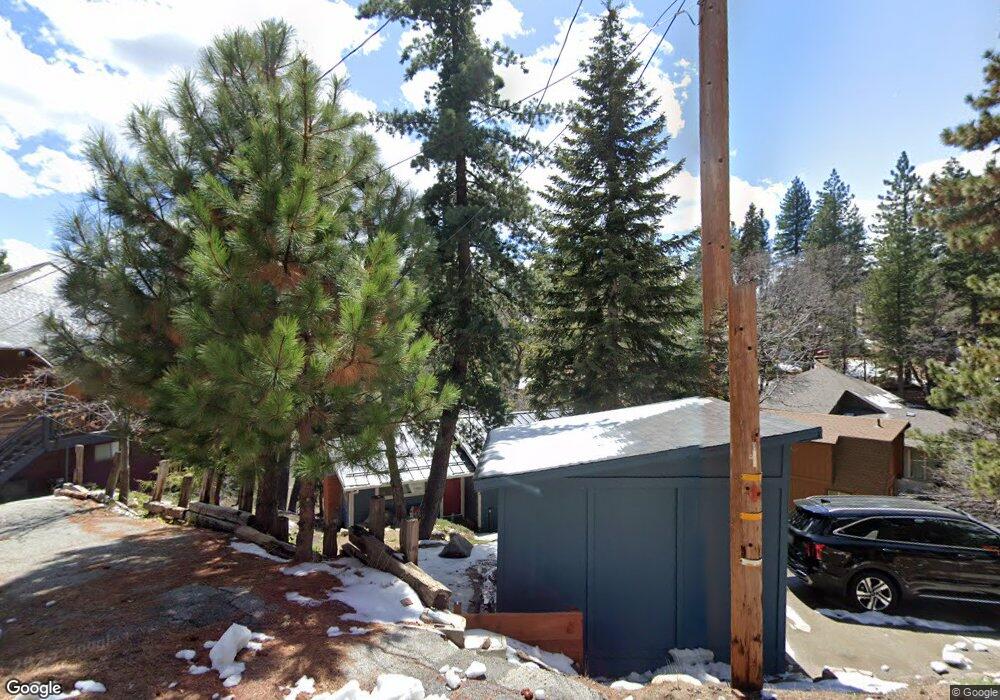
30813 Allview Dr Running Springs, CA 92382
Estimated Value: $316,000 - $420,000
2
Beds
1
Bath
1,668
Sq Ft
$214/Sq Ft
Est. Value
About This Home
This home is located at 30813 Allview Dr, Running Springs, CA 92382 and is currently estimated at $357,210, approximately $214 per square foot. 30813 Allview Dr is a home located in San Bernardino County with nearby schools including Charles Hoffman Elementary School, Mary P. Henck Intermediate School, and Rim Of The World Senior High School.
Ownership History
Date
Name
Owned For
Owner Type
Purchase Details
Closed on
Jan 14, 2021
Sold by
Ortega Robin Bennett
Bought by
Robin Bennett Ortega Trust and Ortega
Current Estimated Value
Purchase Details
Closed on
Dec 15, 2020
Sold by
Ortega Kellie Nicole and Ortega Lindsay Rachele
Bought by
Kno Lro Llc
Purchase Details
Closed on
Sep 23, 2013
Sold by
Ortega Robin Bennett
Bought by
Ortega Robin Bennett and Robin Bennett Ortega Trust
Purchase Details
Closed on
Jan 11, 2013
Sold by
Jasgur Craig S
Bought by
Ortega Robn Bennett
Purchase Details
Closed on
Apr 26, 2005
Sold by
Phillips Charles R
Bought by
Jasgur Craig S and Jasgur Rene
Home Financials for this Owner
Home Financials are based on the most recent Mortgage that was taken out on this home.
Original Mortgage
$152,000
Interest Rate
5.65%
Mortgage Type
Fannie Mae Freddie Mac
Create a Home Valuation Report for This Property
The Home Valuation Report is an in-depth analysis detailing your home's value as well as a comparison with similar homes in the area
Home Values in the Area
Average Home Value in this Area
Purchase History
| Date | Buyer | Sale Price | Title Company |
|---|---|---|---|
| Robin Bennett Ortega Trust | -- | -- | |
| Kno Lro Llc | -- | None Available | |
| Ortega Kellie Nicole | -- | None Available | |
| Ortega Robin Bennett | -- | None Available | |
| Ortega Robn Bennett | $70,000 | Orange Coast Title Company O | |
| Jasgur Craig S | $185,000 | Commonwealth Title |
Source: Public Records
Mortgage History
| Date | Status | Borrower | Loan Amount |
|---|---|---|---|
| Previous Owner | Jasgur Craig S | $152,000 |
Source: Public Records
Tax History Compared to Growth
Tax History
| Year | Tax Paid | Tax Assessment Tax Assessment Total Assessment is a certain percentage of the fair market value that is determined by local assessors to be the total taxable value of land and additions on the property. | Land | Improvement |
|---|---|---|---|---|
| 2025 | $2,918 | $228,877 | $10,330 | $218,547 |
| 2024 | $2,918 | $224,389 | $10,127 | $214,262 |
| 2023 | $1,620 | $112,734 | $9,928 | $102,806 |
| 2022 | $1,246 | $81,113 | $9,734 | $71,379 |
| 2021 | $1,235 | $79,522 | $9,543 | $69,979 |
| 2020 | $1,369 | $78,706 | $9,445 | $69,261 |
| 2019 | $1,210 | $77,163 | $9,260 | $67,903 |
| 2018 | $1,154 | $75,650 | $9,078 | $66,572 |
| 2017 | $1,137 | $74,167 | $8,900 | $65,267 |
| 2016 | $1,109 | $72,712 | $8,725 | $63,987 |
| 2015 | $1,100 | $71,620 | $8,594 | $63,026 |
| 2014 | $1,085 | $70,217 | $8,426 | $61,791 |
Source: Public Records
Map
Nearby Homes
- 30741 Live Oak Dr
- 30919 Valley Oak Dr
- 30668 Ferndale Dr
- 30757 Knoll View Dr
- 30696 Ferndale Dr
- 30909 Summit Dr
- 246 Lot Ferndale Dr
- Lot 246 Ferndale Dr
- 30607 Live Oak Dr
- 30611 Ferndale Dr
- 2477 Spring Oak Dr
- 31009 Summit Dr
- 2461 Spring Oak Dr
- 2450 Spring Oak Dr
- 30997 Wild Oak Dr
- 30955 Scenic Way
- 30904 Live Oak Dr
- 31140 Summit Dr
- 31115 All View Dr
- 31116 All View Dr
- 30823 All View Dr
- 30805 All View Dr
- 30831 All View Dr
- 30806 All View Dr
- 30795 All View Dr
- 30832 All View Dr
- 30792 All View Dr
- 30785 Knoll View Dr
- 30841 All View Dr
- 30793 Knoll View Dr
- 30789 All View Dr
- 30805 Live Oak Dr
- 30852 All View Dr
- 30799 Live Oak Dr
- 30811 Live Oak Dr
- 30849 All View Dr
- 30781 Knollview Place
- 30781 Knoll View Dr
- 30783 All View Dr
- 30777 Knollview Place