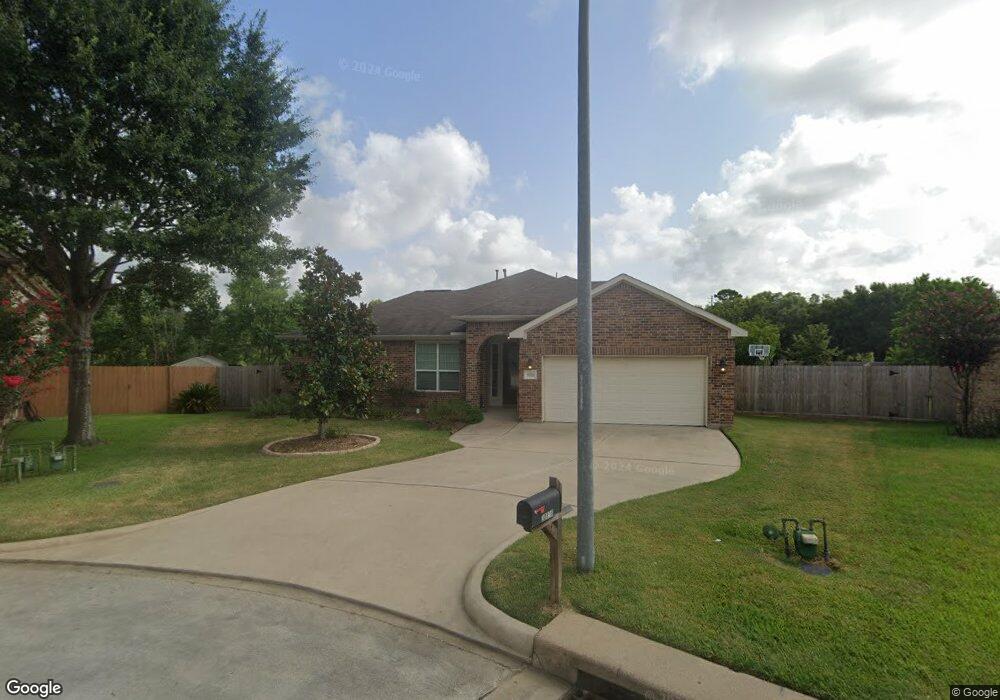
30818 Country Meadows Dr Tomball, TX 77375
Estimated Value: $324,927 - $357,000
4
Beds
2
Baths
1,926
Sq Ft
$177/Sq Ft
Est. Value
About This Home
This home is located at 30818 Country Meadows Dr, Tomball, TX 77375 and is currently estimated at $341,232, approximately $177 per square foot. 30818 Country Meadows Dr is a home located in Harris County with nearby schools including Tomball Elementary School, Tomball Intermediate School, and Tomball Junior High School.
Ownership History
Date
Name
Owned For
Owner Type
Purchase Details
Closed on
Dec 3, 2013
Sold by
Legacy Custom Homes Inc
Bought by
Terrasson Keira
Current Estimated Value
Home Financials for this Owner
Home Financials are based on the most recent Mortgage that was taken out on this home.
Original Mortgage
$139,600
Outstanding Balance
$104,177
Interest Rate
4.17%
Mortgage Type
New Conventional
Estimated Equity
$237,055
Purchase Details
Closed on
May 10, 2013
Sold by
Country Meadows Tomball Ltd
Bought by
Legacy Custom Homes Inc
Home Financials for this Owner
Home Financials are based on the most recent Mortgage that was taken out on this home.
Original Mortgage
$112,362
Interest Rate
3.43%
Mortgage Type
New Conventional
Purchase Details
Closed on
Oct 23, 2007
Sold by
Legacy Custom Homes Inc
Bought by
Country Meadows Tomball Ltd
Create a Home Valuation Report for This Property
The Home Valuation Report is an in-depth analysis detailing your home's value as well as a comparison with similar homes in the area
Home Values in the Area
Average Home Value in this Area
Purchase History
| Date | Buyer | Sale Price | Title Company |
|---|---|---|---|
| Terrasson Keira | -- | Charter Title Co | |
| Legacy Custom Homes Inc | -- | None Available | |
| Country Meadows Tomball Ltd | -- | None Available |
Source: Public Records
Mortgage History
| Date | Status | Borrower | Loan Amount |
|---|---|---|---|
| Open | Terrasson Keira | $139,600 | |
| Previous Owner | Legacy Custom Homes Inc | $112,362 |
Source: Public Records
Tax History Compared to Growth
Tax History
| Year | Tax Paid | Tax Assessment Tax Assessment Total Assessment is a certain percentage of the fair market value that is determined by local assessors to be the total taxable value of land and additions on the property. | Land | Improvement |
|---|---|---|---|---|
| 2025 | $5,806 | $354,677 | $59,008 | $295,669 |
| 2024 | $5,806 | $329,760 | $57,895 | $271,865 |
| 2023 | $5,806 | $373,201 | $57,895 | $315,306 |
| 2022 | $6,447 | $325,000 | $57,895 | $267,105 |
| 2021 | $6,167 | $270,911 | $48,246 | $222,665 |
| 2020 | $5,797 | $236,374 | $38,968 | $197,406 |
| 2019 | $5,596 | $221,821 | $38,968 | $182,853 |
| 2018 | $2,496 | $211,277 | $25,236 | $186,041 |
| 2017 | $5,104 | $211,277 | $25,236 | $186,041 |
| 2016 | $4,640 | $184,119 | $25,236 | $158,883 |
| 2015 | $3,789 | $184,119 | $25,236 | $158,883 |
| 2014 | $3,789 | $156,911 | $25,236 | $131,675 |
Source: Public Records
Map
Nearby Homes
- 13303 Lost Creek Rd
- 14134 Pollux Ct
- 31414 Helen Ln
- 31410 Bearing Star Ln
- 14123 Spring Pines Dr
- 14210 Altair Dr
- 31318 Bearing Star Ln
- 1302 Pine Trail
- 31407 Bearing Star Ln
- 31335 Bearing Star Ln
- 930 Arbor Pine
- 11211 Stirton Dr
- 11235 Stirton Dr
- 14222 Spring Pines Dr
- 1319 Pine Trail
- 1310 Big Pines
- 1315 Big Pines
- 1314 Pine Brook
- 1126 Audrey Trail
- 14219 Turnervine Dr
- 30814 Country Meadows Dr
- 30819 Country Meadows Dr
- 30810 Country Meadows Dr
- 30815 Country Meadows Dr
- 30806 Country Meadows Dr
- 30811 Country Meadows Dr
- 30803 Martens Rd
- 13602 Country Pine Ct
- 30802 Country Meadows Dr
- 30802 Country Meadows Dr Unit 2
- 13606 Country Pine Ct
- 30801 Martens Rd
- 30735 Martens Rd
- 13642 Country Pine Ct
- 13610 Country Pine Ct
- 13638 Country Pine Ct
- 30722 Country Meadows Dr
- 13614 Country Pine Ct
- 13603 Country Pine Ct
- 30823 Martens Rd