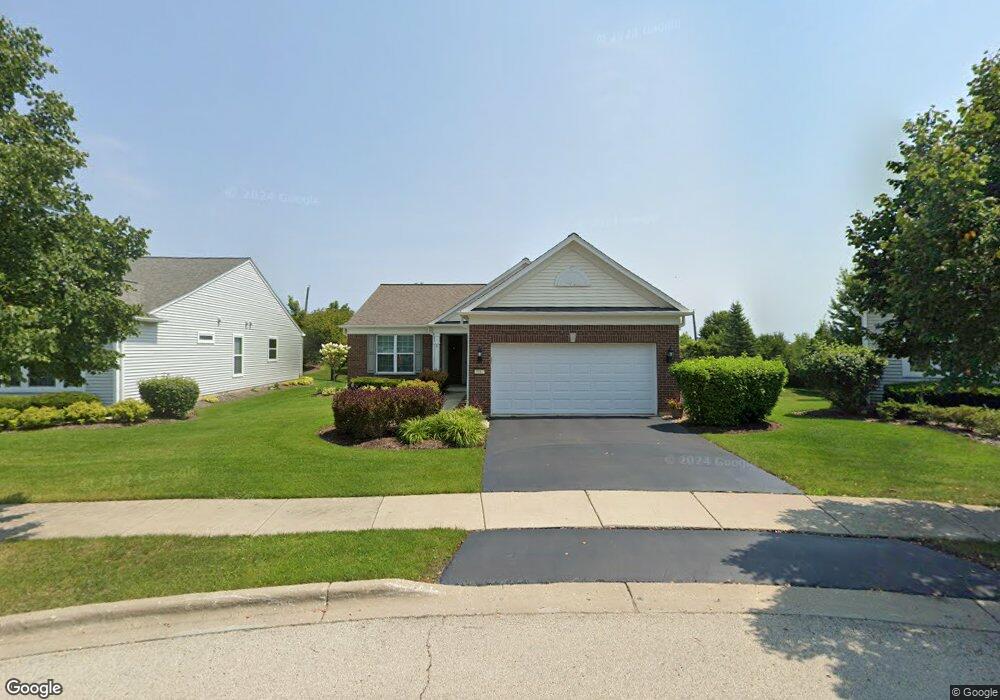
3082 Ravinia Cir Mundelein, IL 60060
Ivanhoe NeighborhoodEstimated Value: $453,000 - $479,115
2
Beds
2
Baths
1,676
Sq Ft
$279/Sq Ft
Est. Value
About This Home
This home is located at 3082 Ravinia Cir, Mundelein, IL 60060 and is currently estimated at $467,529, approximately $278 per square foot. 3082 Ravinia Cir is a home with nearby schools including Fremont Elementary School, Fremont Intermediate School, and Fremont Jr High/Middle School.
Ownership History
Date
Name
Owned For
Owner Type
Purchase Details
Closed on
Jul 8, 2025
Sold by
Solomon Gelfond Living Trust and Vicky M Gelfond Living Trust
Bought by
Solomon Gelfond And Vicky M Gelfond Joint Tru and Gelfond
Current Estimated Value
Purchase Details
Closed on
Apr 23, 2010
Sold by
Gelfond Vicky M
Bought by
Gelfond Solomon and Gelfond Vicky M
Home Financials for this Owner
Home Financials are based on the most recent Mortgage that was taken out on this home.
Original Mortgage
$48,000
Interest Rate
5.05%
Mortgage Type
New Conventional
Purchase Details
Closed on
Nov 6, 2008
Sold by
Gelfond Solomon and Gelfond Vicky M
Bought by
Gelfond Vicky M and Gelfond Solomon
Purchase Details
Closed on
Dec 18, 2007
Sold by
Pulte Home Corp
Bought by
Gelfond Solomon and Gelfond Vicky M
Home Financials for this Owner
Home Financials are based on the most recent Mortgage that was taken out on this home.
Original Mortgage
$299,708
Interest Rate
6.31%
Mortgage Type
Unknown
Create a Home Valuation Report for This Property
The Home Valuation Report is an in-depth analysis detailing your home's value as well as a comparison with similar homes in the area
Home Values in the Area
Average Home Value in this Area
Purchase History
| Date | Buyer | Sale Price | Title Company |
|---|---|---|---|
| Solomon Gelfond And Vicky M Gelfond Joint Tru | -- | None Listed On Document | |
| Gelfond Solomon | -- | Acquest Title Services Llc | |
| Gelfond Vicky M | -- | None Available | |
| Gelfond Solomon | $375,000 | Pulte Midwest Title South |
Source: Public Records
Mortgage History
| Date | Status | Borrower | Loan Amount |
|---|---|---|---|
| Previous Owner | Gelfond Solomon | $48,000 | |
| Previous Owner | Gelfond Solomon | $200,000 | |
| Previous Owner | Gelfond Solomon | $299,708 |
Source: Public Records
Tax History Compared to Growth
Tax History
| Year | Tax Paid | Tax Assessment Tax Assessment Total Assessment is a certain percentage of the fair market value that is determined by local assessors to be the total taxable value of land and additions on the property. | Land | Improvement |
|---|---|---|---|---|
| 2024 | $9,298 | $128,956 | $38,619 | $90,337 |
| 2023 | $9,298 | $118,157 | $35,385 | $82,772 |
| 2022 | $8,829 | $107,240 | $30,122 | $77,118 |
| 2021 | $8,420 | $103,484 | $29,067 | $74,417 |
| 2020 | $8,753 | $104,102 | $28,267 | $75,835 |
| 2019 | $8,450 | $100,679 | $27,338 | $73,341 |
| 2018 | $7,055 | $97,769 | $25,761 | $72,008 |
| 2017 | $7,974 | $94,691 | $24,950 | $69,741 |
| 2016 | $7,763 | $89,933 | $23,696 | $66,237 |
| 2015 | $7,584 | $84,309 | $22,214 | $62,095 |
| 2014 | $7,784 | $86,480 | $27,345 | $59,135 |
| 2012 | $7,707 | $87,248 | $27,588 | $59,660 |
Source: Public Records
Map
Nearby Homes
- 2982 Ravinia Cir
- 3161 Marshall Ln
- 3162 Eastbank Cir
- 3263 Eastbank Cir
- 3184 Comstock Ct
- 1664 Brighton Dr
- 1912 Friars Ln
- 1077 Kessler Dr
- 1067 Kessler Dr
- 1066 Kessler Dr
- 1632 Brighton Dr
- 1146 Kessler Dr
- 1156 Kessler Dr
- 1177 Kessler Dr
- 1166 Kessler Dr
- 1093 Joice Ln
- 1103 Joice Ln
- 1084 Joice Ln
- 1186 Kessler Dr
- 1207 Kessler Dr
- 3092 Ravinia Cir
- 3102 Ravinia Cir
- 3072 Ravinia Cir
- 3062 Ravinia Cir
- 3112 Ravinia Cir
- 3052 Ravinia Cir
- 3051 Ravinia Cir
- 3042 Ravinia Cir
- 3122 Ravinia Cir
- 3041 Ravinia Cir
- 3132 Ravinia Cir
- 3031 Ravinia Cir
- 3171 Ravinia Cir
- 3032 Ravinia Cir
- 3142 Ravinia Cir
- 3021 Ravinia Cir
- 3043 Eastbank Cir
- 3181 Ravinia Cir
- 3022 Ravinia Cir
- 3152 Ravinia Cir