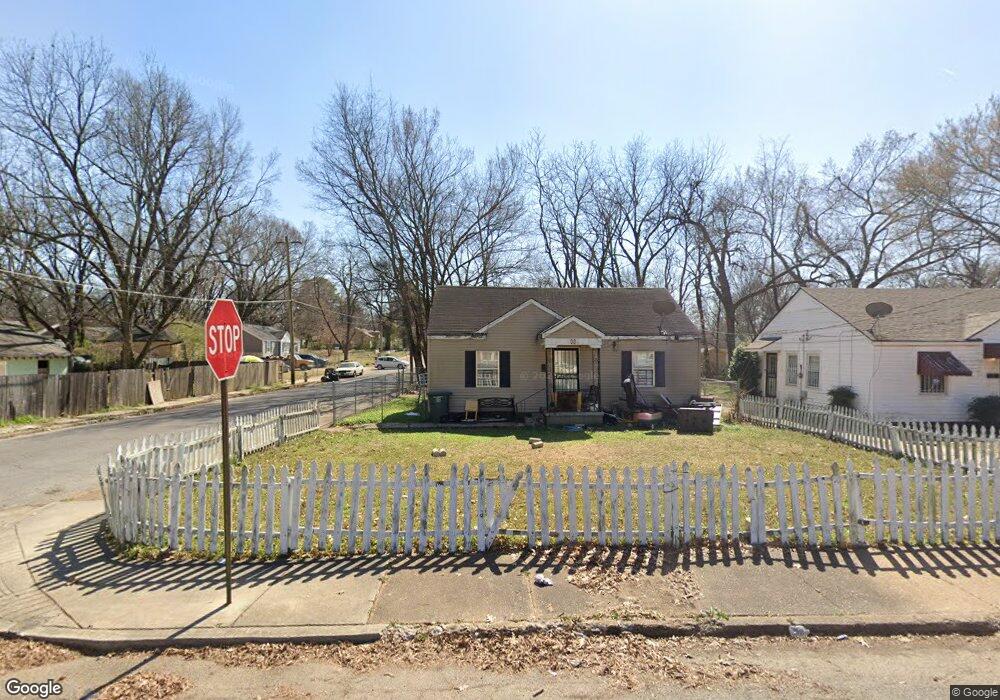
3083 Given Ave Memphis, TN 38112
Binghampton NeighborhoodEstimated Value: $50,000 - $103,000
2
Beds
1
Bath
948
Sq Ft
$75/Sq Ft
Est. Value
About This Home
This home is located at 3083 Given Ave, Memphis, TN 38112 and is currently estimated at $70,726, approximately $74 per square foot. 3083 Given Ave is a home located in Shelby County with nearby schools including Treadwell Elementary School, Treadwell Middle School, and Douglass High School.
Ownership History
Date
Name
Owned For
Owner Type
Purchase Details
Closed on
Oct 7, 2010
Sold by
Alexander Charles and Alexander Patricia
Bought by
States Resources Corp
Current Estimated Value
Purchase Details
Closed on
Jun 7, 2006
Sold by
Davis Ronnie
Bought by
Alexander Charles W and Alexander Patricia
Home Financials for this Owner
Home Financials are based on the most recent Mortgage that was taken out on this home.
Original Mortgage
$49,600
Interest Rate
6.71%
Mortgage Type
Unknown
Purchase Details
Closed on
Dec 6, 2001
Sold by
Whizin Grapel D and Whizin Thomas Anthony
Bought by
Davis Ronnie L
Home Financials for this Owner
Home Financials are based on the most recent Mortgage that was taken out on this home.
Original Mortgage
$6,750
Interest Rate
8.5%
Mortgage Type
Unknown
Purchase Details
Closed on
Sep 9, 1998
Sold by
Va
Bought by
Tennessee Housing Development Agency
Create a Home Valuation Report for This Property
The Home Valuation Report is an in-depth analysis detailing your home's value as well as a comparison with similar homes in the area
Home Values in the Area
Average Home Value in this Area
Purchase History
| Date | Buyer | Sale Price | Title Company |
|---|---|---|---|
| States Resources Corp | $15,000 | None Available | |
| Alexander Charles W | -- | None Available | |
| Davis Ronnie L | $19,000 | -- | |
| Davis Ronnie L | $19,000 | -- | |
| Tennessee Housing Development Agency | -- | -- | |
| Tennessee Housing Development Agency | -- | -- |
Source: Public Records
Mortgage History
| Date | Status | Borrower | Loan Amount |
|---|---|---|---|
| Previous Owner | Alexander Charles W | $49,600 | |
| Previous Owner | Davis Ronnie L | $6,750 | |
| Previous Owner | Davis Ronnie L | $38,250 |
Source: Public Records
Tax History
| Year | Tax Paid | Tax Assessment Tax Assessment Total Assessment is a certain percentage of the fair market value that is determined by local assessors to be the total taxable value of land and additions on the property. | Land | Improvement |
|---|---|---|---|---|
| 2025 | $231 | $11,900 | $2,250 | $9,650 |
| 2024 | $231 | $6,825 | $1,125 | $5,700 |
| 2023 | $416 | $6,825 | $1,125 | $5,700 |
| 2022 | $416 | $6,825 | $1,125 | $5,700 |
| 2021 | $421 | $6,825 | $1,125 | $5,700 |
| 2020 | $428 | $5,900 | $1,125 | $4,775 |
| 2019 | $428 | $5,900 | $1,125 | $4,775 |
| 2018 | $428 | $5,900 | $1,125 | $4,775 |
| 2017 | $242 | $5,900 | $1,125 | $4,775 |
| 2016 | $276 | $6,325 | $0 | $0 |
| 2014 | $276 | $6,325 | $0 | $0 |
Source: Public Records
Map
Nearby Homes
- 3073 Coleman Ave
- 3084 Guernsey Ave
- 3070 Guernsey Ave
- 3079 Henry Ave
- 3174 Given Ave
- 3084 Pershing Ave
- 971 Hudson St
- 3126 Crump Ave
- 1009 Hudson St
- 3250 Guernsey Ave
- 3079 Tutwiler Ave
- 778 Atlantic St
- 3117 Pacific Ave
- 3319 Given Ave
- 1057 N Holmes St
- 3143 Pacific Ave
- 2881 Tutwiler Ave
- 3323 Henry Ave
- 3299 Bowen Ave
- 683 Hudson St
- 3077 Given Ave
- 3073 Given Ave
- 3093 Given Ave
- 3097 Given Ave
- 3082 Coleman Ave
- 3067 Given Ave
- 3078 Coleman Ave
- 914 Baltic St
- 3074 Coleman Ave
- 941 Baltic St
- 3080 Given Ave
- 3101 Given Ave
- 908 Baltic St
- 3063 Given Ave
- 3074 Given Ave
- 942 Baltic St
- 3070 Given Ave
- 3107 Given Ave
- 3059 Given Ave
- 3064 Coleman Ave
Your Personal Tour Guide
Ask me questions while you tour the home.