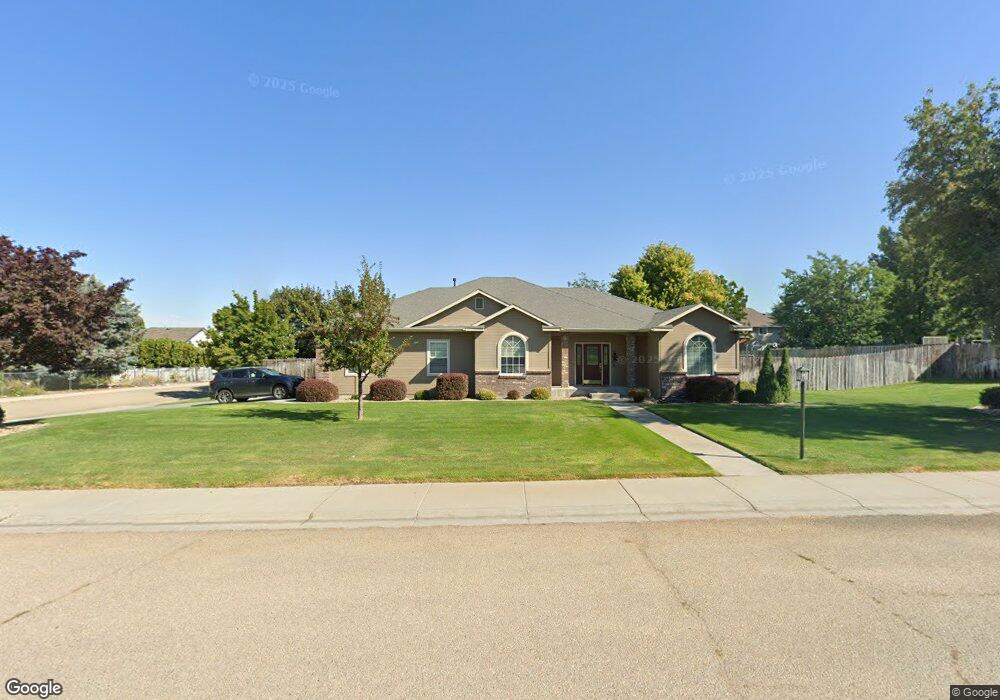
3085 Windfall Cir Emmett, ID 83617
Gem County NeighborhoodEstimated Value: $563,283 - $701,000
3
Beds
3
Baths
2,529
Sq Ft
$245/Sq Ft
Est. Value
About This Home
This home is located at 3085 Windfall Cir, Emmett, ID 83617 and is currently estimated at $619,821, approximately $245 per square foot. 3085 Windfall Cir is a home located in Gem County with nearby schools including Kenneth Carberry Intermediate School and Calvary Christian Academy.
Ownership History
Date
Name
Owned For
Owner Type
Purchase Details
Closed on
Nov 20, 2020
Sold by
Low Staci W and Low Nathan G
Bought by
Low Nathan G and Low Jstacij E
Current Estimated Value
Home Financials for this Owner
Home Financials are based on the most recent Mortgage that was taken out on this home.
Original Mortgage
$264,300
Interest Rate
2.8%
Mortgage Type
New Conventional
Purchase Details
Closed on
Sep 18, 2017
Sold by
Low Staci W and Low Nathan G
Bought by
Low Nathan G and Low Staci E
Home Financials for this Owner
Home Financials are based on the most recent Mortgage that was taken out on this home.
Original Mortgage
$240,000
Interest Rate
3.9%
Mortgage Type
New Conventional
Purchase Details
Closed on
Dec 4, 2008
Sold by
Low Nathan G and Low Staci W
Bought by
Low Staci W and Low Nathan G
Home Financials for this Owner
Home Financials are based on the most recent Mortgage that was taken out on this home.
Original Mortgage
$276,760
Interest Rate
6.47%
Mortgage Type
FHA
Create a Home Valuation Report for This Property
The Home Valuation Report is an in-depth analysis detailing your home's value as well as a comparison with similar homes in the area
Home Values in the Area
Average Home Value in this Area
Purchase History
| Date | Buyer | Sale Price | Title Company |
|---|---|---|---|
| Low Nathan G | -- | Pioneer Title Co Of Gem Cnty | |
| Low Nathan G | -- | Pioneer Title Co Of Gem C | |
| Low Staci W | -- | -- |
Source: Public Records
Mortgage History
| Date | Status | Borrower | Loan Amount |
|---|---|---|---|
| Closed | Low Nathan G | $264,300 | |
| Closed | Low Nathan G | $240,000 | |
| Closed | Low Staci W | $276,760 |
Source: Public Records
Tax History
| Year | Tax Paid | Tax Assessment Tax Assessment Total Assessment is a certain percentage of the fair market value that is determined by local assessors to be the total taxable value of land and additions on the property. | Land | Improvement |
|---|---|---|---|---|
| 2025 | $1,239 | $524,981 | $116,227 | $408,754 |
| 2024 | $1,239 | $554,411 | $125,942 | $428,469 |
| 2023 | $1,157 | $614,398 | $143,496 | $470,902 |
| 2021 | $1,787 | $503,378 | $92,726 | $410,652 |
| 2020 | $1,777 | $381,920 | $73,353 | $308,567 |
| 2019 | $1,763 | $363,323 | $47,133 | $316,190 |
| 2018 | $1,661 | $315,451 | $35,633 | $279,818 |
| 2017 | $1,676 | $276,470 | $34,510 | $241,960 |
| 2016 | $1,618 | $253,600 | $32,650 | $220,950 |
| 2015 | $1,666 | $250,580 | $30,780 | $219,800 |
| 2014 | $1,666 | $228,430 | $27,040 | $201,390 |
Source: Public Records
Map
Nearby Homes
- 2225 Wildwood Ln
- 2731 Cherry Ln
- 1570 Rome Ave
- 1510 Castle Way
- 2360 S Substation Rd
- 1471 Panama Ave
- 2654 Soulen Dr
- 2663 Soulen Dr
- 2662 Soulen Dr
- 2658 Soulen Dr
- 2508 E Crooked Creek St
- 2744 Soulen Dr
- 1108 E Royalty
- 2678 Landmark St
- 868 S Beaver Creek Way
- 1008 Whitewater Way
- 1885 Stone Dr
- 1006 Whitewater Way
- 1004 Whitewater Way
- 1741 Kayak Rd
- 3075 Windfall Cir
- 3005 Windfall Cir
- 3015 Windfall Cir
- 3090 Windfall Cir
- 2292 Tanglewood Ln
- 2295 Wildwood Ln
- 3065 Windfall Cir
- 3080 Windfall Cir
- 3025 Windfall Cir
- 2295 Tanglewood Ln
- 2281 E
- 3010 Windfall Cir
- 3070 Windfall Cir
- 2284 Tanglewood Ln
- 3020 Windfall Cir
- 2330 Cherry Ln
- 2290 Wildwood Ln
- 2290 Cherry Ln
- 2281 Tanglewood Ln
- 2300 Cherry Ln
Your Personal Tour Guide
Ask me questions while you tour the home.