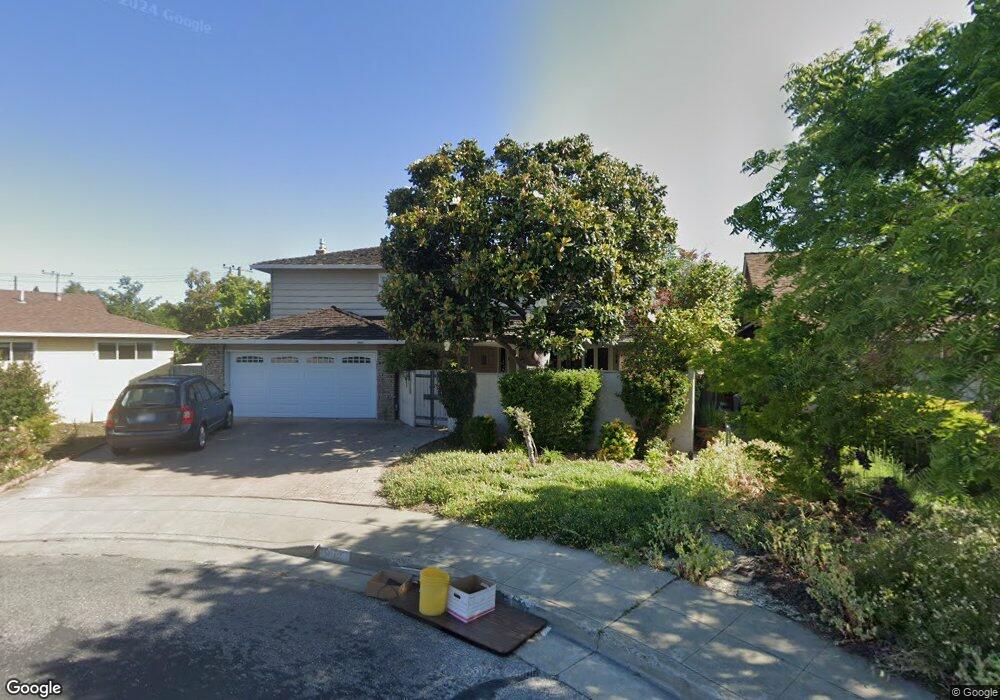
3087 Carleton Place Santa Clara, CA 95051
Pruneridge NeighborhoodEstimated Value: $2,656,000 - $2,861,000
5
Beds
3
Baths
2,252
Sq Ft
$1,233/Sq Ft
Est. Value
About This Home
This home is located at 3087 Carleton Place, Santa Clara, CA 95051 and is currently estimated at $2,777,075, approximately $1,233 per square foot. 3087 Carleton Place is a home located in Santa Clara County with nearby schools including Sutter Elementary School, Buchser Middle School, and Santa Clara High School.
Ownership History
Date
Name
Owned For
Owner Type
Purchase Details
Closed on
Sep 5, 2000
Sold by
Fuchs James A and Fuchs Onalee B
Bought by
Fuchs James A and Fuchs Onalee B
Current Estimated Value
Purchase Details
Closed on
Sep 20, 1996
Sold by
Lee Welin Edward and Lee Sharon F
Bought by
Fuchs James Allen and Fuchs Onalee Beth Whitmore
Home Financials for this Owner
Home Financials are based on the most recent Mortgage that was taken out on this home.
Original Mortgage
$350,000
Outstanding Balance
$19,218
Interest Rate
3.82%
Estimated Equity
$2,757,857
Purchase Details
Closed on
May 16, 1995
Sold by
Welin Edward L
Bought by
Welin Edward L and Welin Sharon F
Home Financials for this Owner
Home Financials are based on the most recent Mortgage that was taken out on this home.
Original Mortgage
$100,000
Interest Rate
8.37%
Create a Home Valuation Report for This Property
The Home Valuation Report is an in-depth analysis detailing your home's value as well as a comparison with similar homes in the area
Home Values in the Area
Average Home Value in this Area
Purchase History
| Date | Buyer | Sale Price | Title Company |
|---|---|---|---|
| Fuchs James A | -- | -- | |
| Fuchs James Allen | $470,000 | Fidelity National Title Co | |
| Welin Edward L | -- | First American Title Guarant |
Source: Public Records
Mortgage History
| Date | Status | Borrower | Loan Amount |
|---|---|---|---|
| Open | Fuchs James Allen | $350,000 | |
| Previous Owner | Welin Edward L | $100,000 |
Source: Public Records
Tax History
| Year | Tax Paid | Tax Assessment Tax Assessment Total Assessment is a certain percentage of the fair market value that is determined by local assessors to be the total taxable value of land and additions on the property. | Land | Improvement |
|---|---|---|---|---|
| 2025 | $8,779 | $765,467 | $407,167 | $358,300 |
| 2024 | $8,779 | $750,459 | $399,184 | $351,275 |
| 2023 | $8,689 | $735,745 | $391,357 | $344,388 |
| 2022 | $8,543 | $721,320 | $383,684 | $337,636 |
| 2021 | $8,508 | $707,177 | $376,161 | $331,016 |
| 2020 | $8,352 | $699,926 | $372,304 | $327,622 |
| 2019 | $8,340 | $686,203 | $365,004 | $321,199 |
| 2018 | $7,804 | $672,749 | $357,848 | $314,901 |
| 2017 | $7,764 | $659,559 | $350,832 | $308,727 |
| 2016 | $7,611 | $646,627 | $343,953 | $302,674 |
| 2015 | $7,581 | $636,915 | $338,787 | $298,128 |
| 2014 | $7,201 | $624,440 | $332,151 | $292,289 |
Source: Public Records
Map
Nearby Homes
- 534 Flannery St
- 638 Woodhams Rd
- 702 Flannery St
- 756 Cornell Dr
- 587 Cambridge Dr
- 714 Hamilton Ln
- 774 Ridge Rd
- 3260 Homestead Rd
- 3329 Mauricia Ave
- 3320 Lochinvar Ave Unit 56
- 720 Harvard Ave
- 3042 Via Siena Place
- 2955 Gala Ct
- 835 Bing Dr Unit 21
- 835 Bing Dr Unit 24
- 835 Bing Dr Unit 29
- 2831 Malabar Ave
- 960 Kiely Blvd Unit F
- 2927 Kaiser Dr
- 2711 Toledo Ave
- 3097 Carleton Place
- 3077 Carleton Place
- 3096 Hazelwood Ave
- 3116 Hazelwood Ave
- 3086 Hazelwood Ave
- 3096 Carleton Place
- 3067 Carleton Place
- 623 Hickory Place
- 633 Hickory Place
- 3076 Hazelwood Ave
- 613 Hickory Place
- 3076 Carleton Place
- 3086 Carleton Place
- 3057 Carleton Place
- 593 Hickory Ct
- 3066 Hazelwood Ave
- 603 Hickory Ct
- 3083 Hazelwood Ave
- 3073 Hazelwood Ave
- 3093 Hazelwood Ave
Your Personal Tour Guide
Ask me questions while you tour the home.