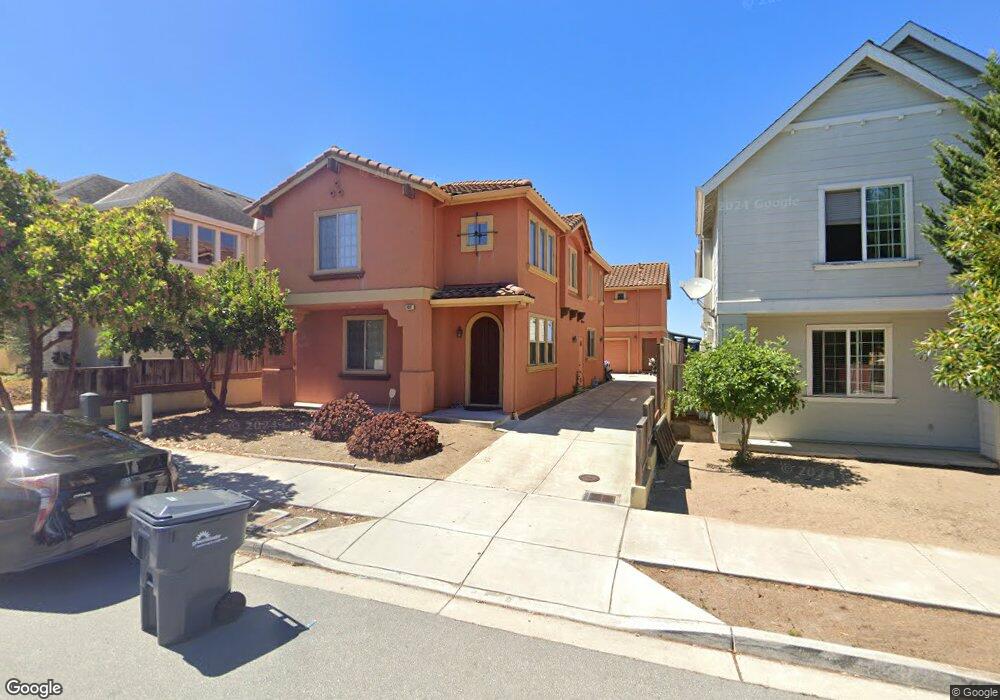
3087 Crescent Ave Marina, CA 93933
Estimated Value: $976,000 - $1,072,317
3
Beds
3
Baths
2,711
Sq Ft
$377/Sq Ft
Est. Value
About This Home
This home is located at 3087 Crescent Ave, Marina, CA 93933 and is currently estimated at $1,020,829, approximately $376 per square foot. 3087 Crescent Ave is a home located in Monterey County with nearby schools including Marina Vista Elementary School, Los Arboles Middle School, and Marina High School.
Ownership History
Date
Name
Owned For
Owner Type
Purchase Details
Closed on
Feb 10, 2017
Sold by
Riazi Shirin
Bought by
Riazi Shirin and The Shirin Riazi 2009 Revocabl
Current Estimated Value
Home Financials for this Owner
Home Financials are based on the most recent Mortgage that was taken out on this home.
Original Mortgage
$455,000
Outstanding Balance
$376,721
Interest Rate
4.2%
Mortgage Type
New Conventional
Estimated Equity
$644,108
Purchase Details
Closed on
Jun 18, 2009
Sold by
Riazi Shirin
Bought by
Riazi Shirin and Shirin Riazi 2009 Revocable Tr
Purchase Details
Closed on
Jan 12, 2006
Sold by
Crescent Street Llc
Bought by
Riazi Shirin
Home Financials for this Owner
Home Financials are based on the most recent Mortgage that was taken out on this home.
Original Mortgage
$533,600
Interest Rate
6.21%
Mortgage Type
Purchase Money Mortgage
Create a Home Valuation Report for This Property
The Home Valuation Report is an in-depth analysis detailing your home's value as well as a comparison with similar homes in the area
Home Values in the Area
Average Home Value in this Area
Purchase History
| Date | Buyer | Sale Price | Title Company |
|---|---|---|---|
| Riazi Shirin | -- | Chicago Title Company | |
| Riazi Shirin | -- | Chicago Title Company | |
| Riazi Shirin | -- | None Available | |
| Riazi Shirin | $795,000 | Old Republic Title |
Source: Public Records
Mortgage History
| Date | Status | Borrower | Loan Amount |
|---|---|---|---|
| Open | Riazi Shirin | $455,000 | |
| Previous Owner | Riazi Shirin | $533,600 |
Source: Public Records
Tax History
| Year | Tax Paid | Tax Assessment Tax Assessment Total Assessment is a certain percentage of the fair market value that is determined by local assessors to be the total taxable value of land and additions on the property. | Land | Improvement |
|---|---|---|---|---|
| 2025 | $8,391 | $980,000 | $475,000 | $505,000 |
| 2024 | $8,391 | $765,000 | $315,000 | $450,000 |
| 2023 | $8,479 | $765,000 | $315,000 | $450,000 |
| 2022 | $8,525 | $765,000 | $315,000 | $450,000 |
| 2021 | $8,506 | $760,000 | $300,000 | $460,000 |
| 2020 | $8,312 | $760,000 | $300,000 | $460,000 |
| 2019 | $8,658 | $742,000 | $300,000 | $442,000 |
| 2018 | $8,503 | $742,000 | $300,000 | $442,000 |
| 2017 | $5,432 | $500,000 | $250,000 | $250,000 |
| 2016 | $5,447 | $500,000 | $250,000 | $250,000 |
| 2015 | $5,446 | $609,975 | $300,000 | $309,975 |
| 2014 | $5,182 | $609,975 | $300,000 | $309,975 |
Source: Public Records
Map
Nearby Homes
- 3128 Crescent Ave Unit 75
- 3053 Berney Dr
- 359 Reindollar Ave
- 356 Reservation Rd Unit 39
- 356 Reservation Rd Unit 50
- 356 Reservation Rd Unit 37
- 3047 Zanetta Dr
- 3137 Seacrest Ave Unit 17
- 3137 Seacrest Ave Unit 5
- 3137 Seacrest Ave Unit 6
- 3003 Crescent St
- 224 Palm Ave
- 221 Mortimers (Unit B) Ln
- 3158 Eucalyptus St Unit 22
- 3062 Eddy Cir
- 3199 White Cir
- 3218 Tallmon St
- 177 San Pablo Ct
- 3139 Lelia Place
- 3055 Bostick Ave
- 3079 Crescent Ave
- 3095 Crescent Ave
- 3091 Crescent Ave
- 3075 Crescent Ave
- 3083 Crescent Ave Unit 3085
- 3071 Crescent Ave
- 3076 Crescent Ave
- 3084 Crescent Ave
- 3082 Crescent Ave
- 3107 Crescent Ave
- 3072 Crescent Ave
- 3069 Crescent Ave
- 3080 Crescent Ave
- 320 Carmel Ave Unit 1
- 320 Carmel Ave Unit 5
- 320 Carmel Ave Unit 3
- 320 Carmel Ave Unit 9
- 320 Carmel Ave Unit 7
- 320 Carmel Ave Unit 4
- 320 Carmel Ave Unit 2
Your Personal Tour Guide
Ask me questions while you tour the home.