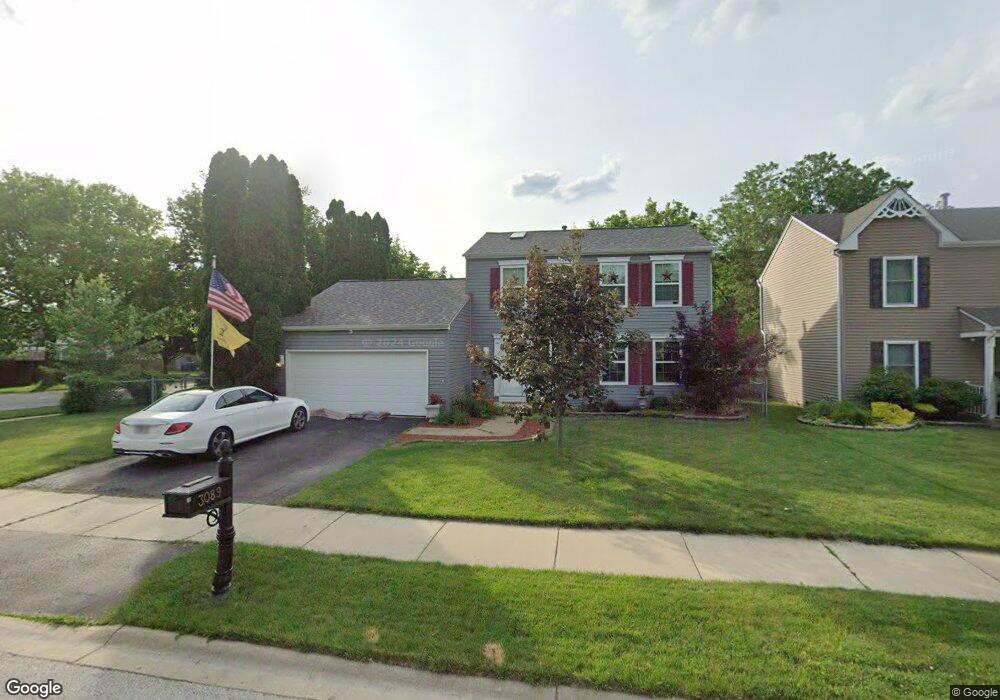
3089 Quincy Ln Unit 19B Aurora, IL 60504
South East Village NeighborhoodEstimated Value: $339,000 - $366,000
3
Beds
2
Baths
1,490
Sq Ft
$239/Sq Ft
Est. Value
About This Home
This home is located at 3089 Quincy Ln Unit 19B, Aurora, IL 60504 and is currently estimated at $356,073, approximately $238 per square foot. 3089 Quincy Ln Unit 19B is a home located in DuPage County with nearby schools including Gombert Elementary School, Fischer Middle School, and Waubonsie Valley High School.
Ownership History
Date
Name
Owned For
Owner Type
Purchase Details
Closed on
Jun 8, 2023
Sold by
Cotton Walter W and Cotton Allison A
Bought by
Walter W Cotton Revocable Trust and Cotton
Current Estimated Value
Purchase Details
Closed on
May 17, 2007
Sold by
Cervantes Joaquin and Cervantes Arlinda
Bought by
Cotton Walter W
Home Financials for this Owner
Home Financials are based on the most recent Mortgage that was taken out on this home.
Original Mortgage
$234,945
Interest Rate
6.27%
Mortgage Type
VA
Purchase Details
Closed on
May 20, 2002
Sold by
Truong Hieu Quang and Truong Nhung Tuyet
Bought by
Cervantes Joaquin and Cervantes Arlinda
Home Financials for this Owner
Home Financials are based on the most recent Mortgage that was taken out on this home.
Original Mortgage
$142,100
Interest Rate
6.82%
Mortgage Type
FHA
Create a Home Valuation Report for This Property
The Home Valuation Report is an in-depth analysis detailing your home's value as well as a comparison with similar homes in the area
Home Values in the Area
Average Home Value in this Area
Purchase History
| Date | Buyer | Sale Price | Title Company |
|---|---|---|---|
| Walter W Cotton Revocable Trust | -- | None Listed On Document | |
| Cotton Walter W | $230,000 | Attorneys Title Guaranty Fun | |
| Cervantes Joaquin | $183,000 | -- |
Source: Public Records
Mortgage History
| Date | Status | Borrower | Loan Amount |
|---|---|---|---|
| Previous Owner | Cotton Walter W | $234,945 | |
| Previous Owner | Cervantes Joaquin | $142,100 |
Source: Public Records
Tax History Compared to Growth
Tax History
| Year | Tax Paid | Tax Assessment Tax Assessment Total Assessment is a certain percentage of the fair market value that is determined by local assessors to be the total taxable value of land and additions on the property. | Land | Improvement |
|---|---|---|---|---|
| 2024 | $6,389 | $92,025 | $22,547 | $69,478 |
| 2023 | $6,070 | $82,690 | $20,260 | $62,430 |
| 2022 | $5,706 | $74,040 | $17,890 | $56,150 |
| 2021 | $5,548 | $71,400 | $17,250 | $54,150 |
| 2020 | $5,616 | $71,400 | $17,250 | $54,150 |
| 2019 | $5,408 | $67,910 | $16,410 | $51,500 |
| 2018 | $4,773 | $60,040 | $14,390 | $45,650 |
| 2017 | $4,685 | $58,000 | $13,900 | $44,100 |
| 2016 | $4,592 | $55,660 | $13,340 | $42,320 |
| 2015 | $4,532 | $52,850 | $12,670 | $40,180 |
| 2014 | $5,053 | $56,720 | $13,490 | $43,230 |
| 2013 | $5,003 | $57,110 | $13,580 | $43,530 |
Source: Public Records
Map
Nearby Homes
- 3290 Johnsbury Ct
- 2860 Bridgeport Ln Unit 19D
- 1334 Normantown Rd Unit 334
- 3144 Johnsbury Ln
- 1465 Bridgeport Ln Unit 19D
- 1335 Lawrence Ct
- 2730 Dorothy Dr Unit 1
- 3479 Charlemaine Dr
- 3467 Charlemaine Dr
- 2723 Rosehall Ln
- 2632 Emma Cir
- 3437 Charlemaine Dr
- 3264 Oak Creek Ln
- 3185 Ketch Ct Unit 606
- 10S154 Schoger Dr
- 2509 Rosehall Ln
- 2489 Rosehall Ln
- 2077 Union Mill Dr
- 3288 Wildlight Rd
- 2476 Village Ct Unit 2
- 3085 Quincy Ln
- 1344 Middlebury Dr Unit 19B
- 3081 Quincy Ln
- 1943 Quincy Ln
- 3100 Quincy Ln Unit 19E
- 1340 Middlebury Dr
- 3092 Quincy Ln
- 3088 Quincy Ln Unit 19B
- 3061 Bar Harbour Rd Unit 19D
- 3077 Quincy Ln Unit 19B
- 3084 Quincy Ln
- 1336 Middlebury Dr
- 3031 Quincy Ct
- 1401 Middlebury Dr
- 3104 Quincy Ln
- 3035 Quincy Ct
- 3047 Bar Harbour Rd
- 3073 Quincy Ln Unit 19B
- 3080 Quincy Ln
- 1404 Middlebury Dr