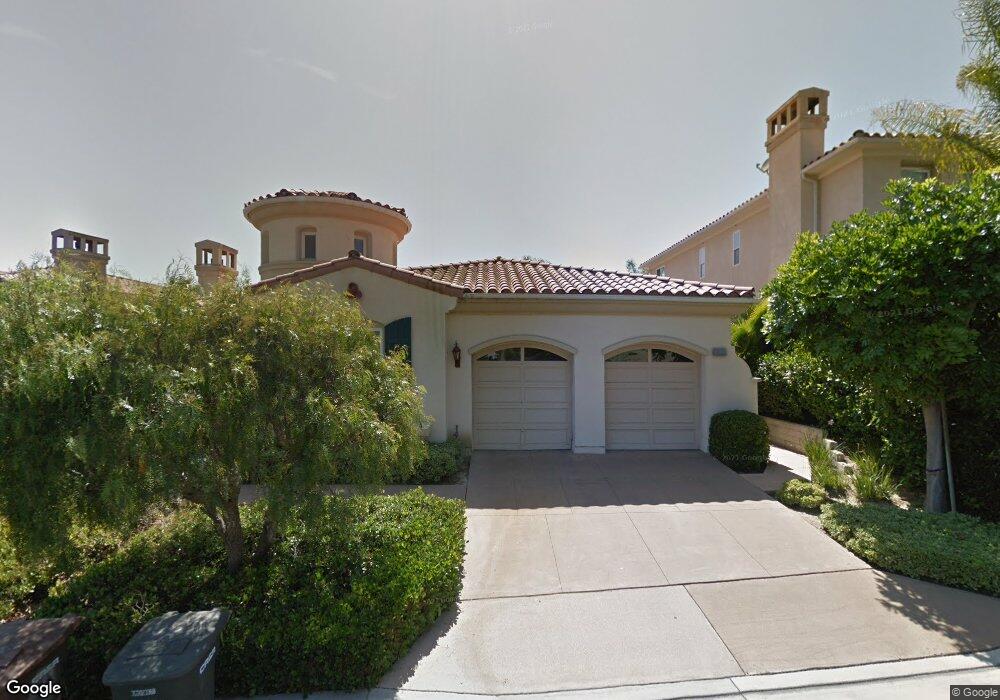
30891 Marbella Vista San Juan Capistrano, CA 92675
Estimated Value: $2,221,826 - $2,556,000
3
Beds
3
Baths
3,247
Sq Ft
$729/Sq Ft
Est. Value
About This Home
This home is located at 30891 Marbella Vista, San Juan Capistrano, CA 92675 and is currently estimated at $2,365,707, approximately $728 per square foot. 30891 Marbella Vista is a home located in Orange County with nearby schools including Harold Ambuehl Elementary School, Marco Forster Middle School, and San Juan Hills High School.
Ownership History
Date
Name
Owned For
Owner Type
Purchase Details
Closed on
Jan 17, 2008
Sold by
Chen Jim and Chen Diana
Bought by
Chen Jim and Chen Diana
Current Estimated Value
Home Financials for this Owner
Home Financials are based on the most recent Mortgage that was taken out on this home.
Original Mortgage
$1,500,000
Outstanding Balance
$943,370
Interest Rate
6.09%
Mortgage Type
Reverse Mortgage Home Equity Conversion Mortgage
Estimated Equity
$1,422,337
Purchase Details
Closed on
Sep 30, 2000
Sold by
Chen Jim and Chen Diana
Bought by
Chen Jim and Chen Diana
Purchase Details
Closed on
Apr 8, 1998
Sold by
Marbella Villas Llc
Bought by
Chen Jim and Chen Diana
Home Financials for this Owner
Home Financials are based on the most recent Mortgage that was taken out on this home.
Original Mortgage
$460,750
Interest Rate
7.05%
Create a Home Valuation Report for This Property
The Home Valuation Report is an in-depth analysis detailing your home's value as well as a comparison with similar homes in the area
Home Values in the Area
Average Home Value in this Area
Purchase History
| Date | Buyer | Sale Price | Title Company |
|---|---|---|---|
| Chen Jim | -- | Lenders Choice Title Company | |
| Chen Jim | -- | -- | |
| Chen Jim | $576,000 | First American Title Ins Co |
Source: Public Records
Mortgage History
| Date | Status | Borrower | Loan Amount |
|---|---|---|---|
| Open | Chen Jim | $1,500,000 | |
| Closed | Chen Jim | $460,750 |
Source: Public Records
Tax History Compared to Growth
Tax History
| Year | Tax Paid | Tax Assessment Tax Assessment Total Assessment is a certain percentage of the fair market value that is determined by local assessors to be the total taxable value of land and additions on the property. | Land | Improvement |
|---|---|---|---|---|
| 2025 | $9,567 | $919,730 | $412,860 | $506,870 |
| 2024 | $9,567 | $901,697 | $404,765 | $496,932 |
| 2023 | $9,312 | $884,017 | $396,828 | $487,189 |
| 2022 | $8,871 | $866,684 | $389,047 | $477,637 |
| 2021 | $8,707 | $849,691 | $381,419 | $468,272 |
| 2020 | $8,629 | $840,979 | $377,508 | $463,471 |
| 2019 | $8,468 | $824,490 | $370,106 | $454,384 |
| 2018 | $8,315 | $808,324 | $362,849 | $445,475 |
| 2017 | $8,238 | $792,475 | $355,734 | $436,741 |
| 2016 | $8,085 | $776,937 | $348,759 | $428,178 |
| 2015 | $7,961 | $765,267 | $343,520 | $421,747 |
| 2014 | $7,819 | $750,277 | $336,791 | $413,486 |
Source: Public Records
Map
Nearby Homes
- 30981 Via Mirador
- 90 Plaza de Las Flores
- 70 Plaza Cuesta
- 30532 Marbella Vista
- 30828 Calle Chueca
- 27381 Via Priorato
- 31121 Via Santo Tomas
- 31261 Paseo Olivos
- 31024 Calle San Diego Unit 94b
- 26447 Paseo Carmel Unit 11D
- 26468 Calle San Antonio
- 31278 Calle San Juan Unit 12
- 31284 Calle San Juan Unit 14
- 27591 Rolling Wood Ln
- 31377 Los Rios St Unit 64
- 30372 Marbella Vista
- 27703 Ortega Hwy Unit 13
- 27703 Ortega Hwy Unit 127
- 30431 Via Festivo
- 26861 Canyon Crest Rd
- 30901 Marbella Vista
- 30881 Marbella Vista
- 30882 Via Ultimo
- 30911 Marbella Vista
- 30871 Marbella Vista
- 30872 Via Ultimo
- 30892 Via Ultimo
- 30862 Via Ultimo
- 30902 Via Ultimo
- 30921 Marbella Vista
- 30861 Marbella Vista
- 30852 Via Ultimo
- 30922 Via Ultimo
- 30931 Via Bravo
- 30931 Marbella Vista
- 30851 Marbella Corte
- 30842 Via Ultimo
- 30871 Via Ultimo
- 30881 Via Ultimo
- 30891 Via Ultimo