B
Seller's Agent in 2025
Brad Burke
Burke Real Estate
(507) 259-5070
14 in this area
22 Total Sales
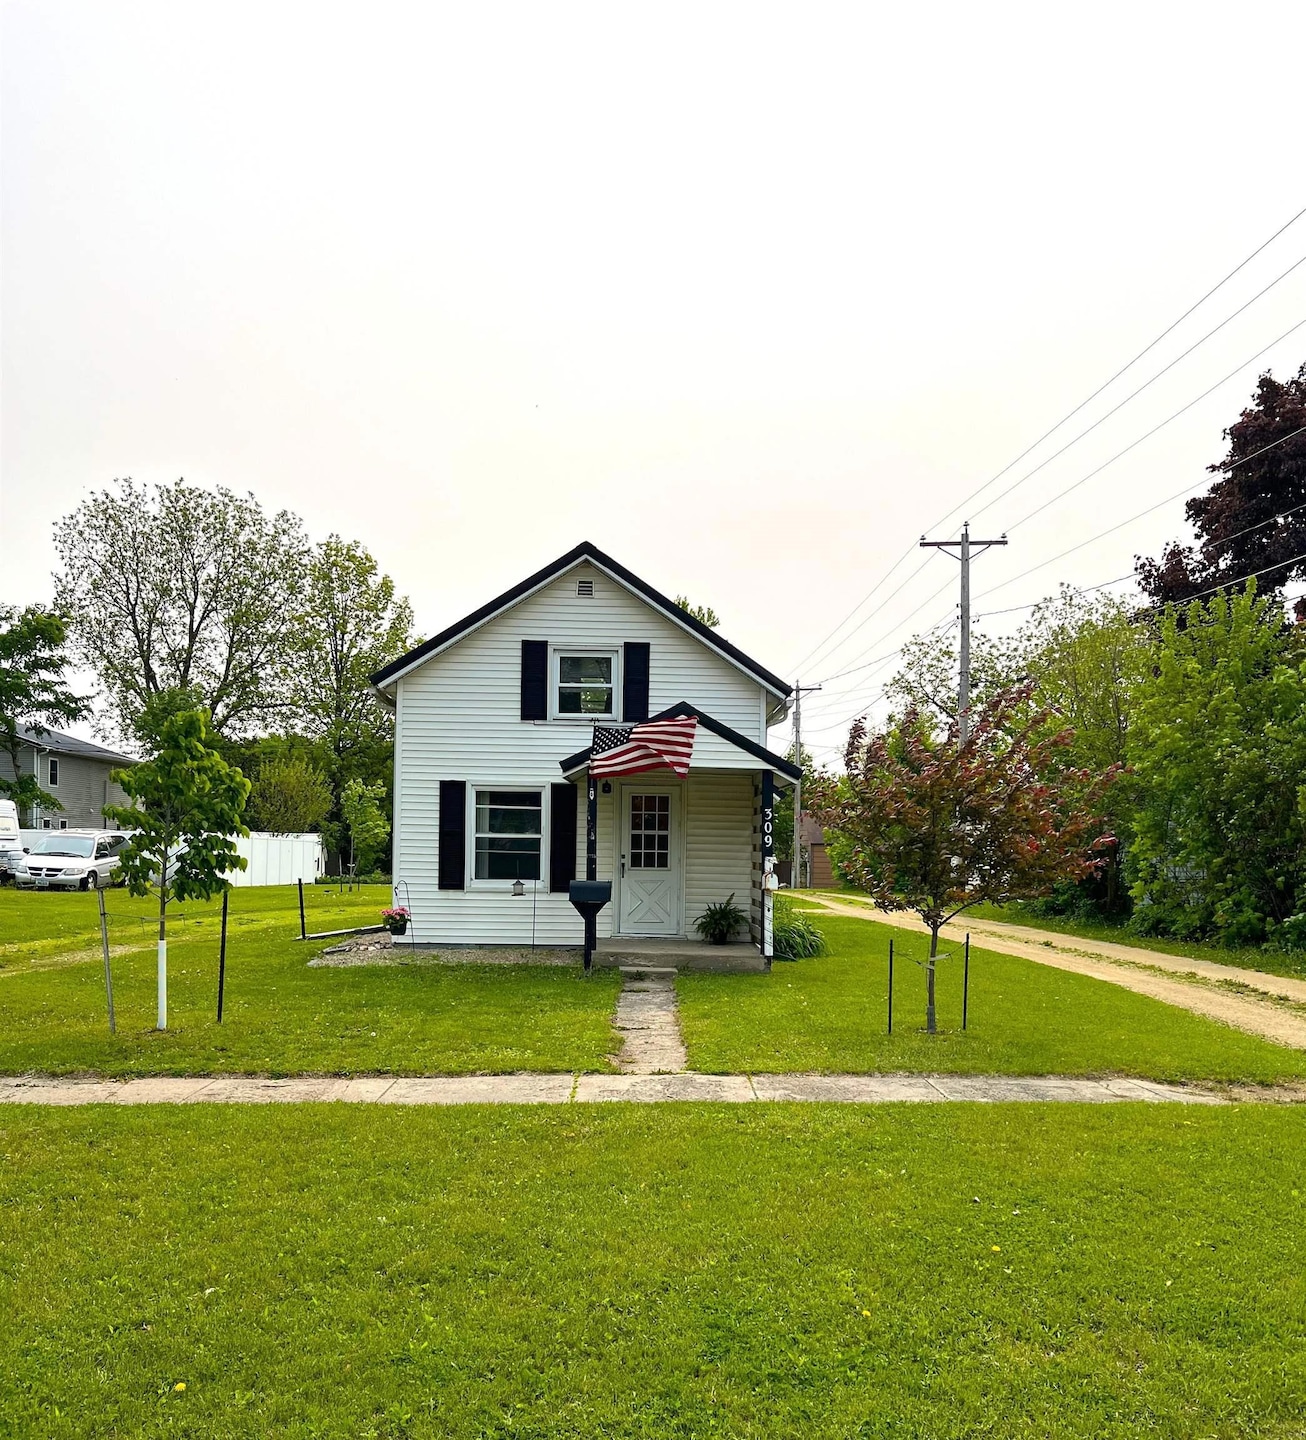
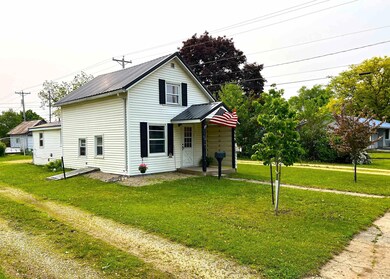
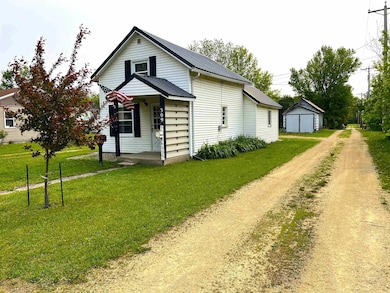
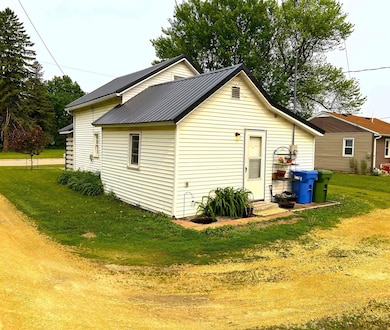
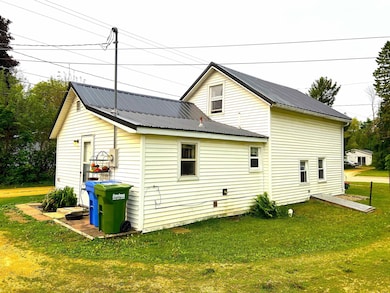
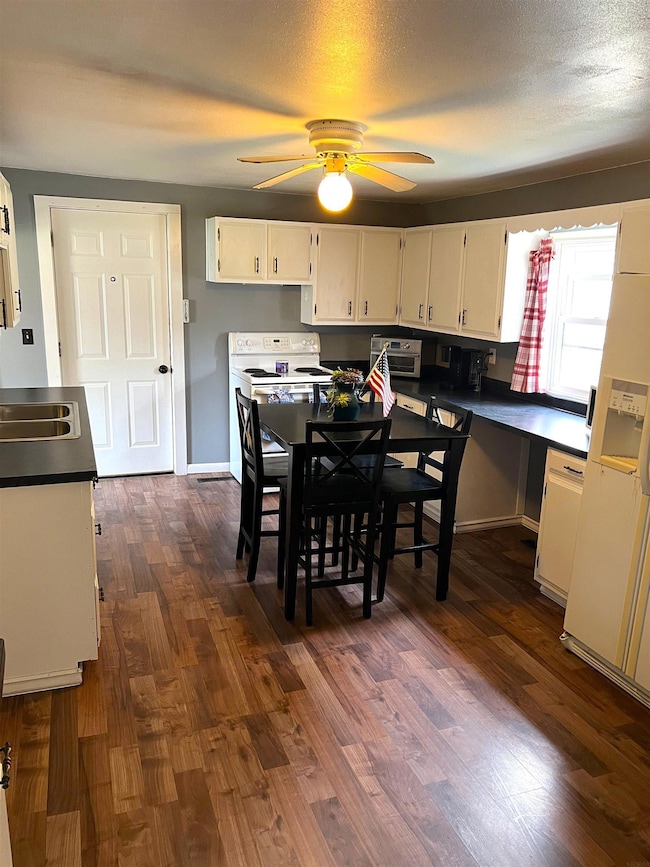
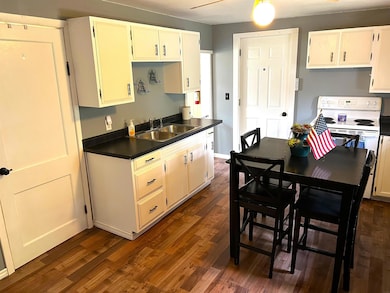
!!Attention!! Check out this nice 2-bedroom home. This house would be perfect for a starter home or an extra income rental house. On the main level you'll find a nice well-kept kitchen dining combo, laundry room, living room and bedroom. Upstairs is the loft/2nd bedroom area. Outside lot is 50' by 150' with a 240sqft garage, garden area and outside entrance to the basement. Basement has a sump pump-gas furnace and water heater. This home is located with-in walking distance from downtown Cresco, bike/walking trail, Parks and Schools. Bonus appliances are negotiable!! Don't wait book a showing today, this property won't last long on the market!!
| Date | Type | Sale Price | Title Company |
|---|---|---|---|
| Warranty Deed | $68,000 | None Listed On Document | |
| Warranty Deed | $17,000 | None Available |
| Date | Status | Loan Amount | Loan Type |
|---|---|---|---|
| Open | $67,500 | VA | |
| Previous Owner | $15,710 | Future Advance Clause Open End Mortgage |
| Date | Event | Price | List to Sale | Price per Sq Ft |
|---|---|---|---|---|
| 08/05/2025 08/05/25 | Sold | $67,500 | +8.0% | $81 / Sq Ft |
| 06/08/2025 06/08/25 | Pending | -- | -- | -- |
| 06/07/2025 06/07/25 | For Sale | $62,500 | -- | $75 / Sq Ft |
| Year | Tax Paid | Tax Assessment Tax Assessment Total Assessment is a certain percentage of the fair market value that is determined by local assessors to be the total taxable value of land and additions on the property. | Land | Improvement |
|---|---|---|---|---|
| 2025 | $502 | $42,150 | $5,000 | $37,150 |
| 2024 | $502 | $37,440 | $5,000 | $32,440 |
| 2023 | $492 | $37,440 | $5,000 | $32,440 |
| 2022 | $564 | $28,220 | $5,000 | $23,220 |
| 2021 | $536 | $28,220 | $5,000 | $23,220 |
| 2020 | $528 | $25,390 | $5,000 | $20,390 |
| 2019 | $514 | $23,920 | $0 | $0 |
| 2018 | $508 | $23,920 | $0 | $0 |
| 2017 | $552 | $25,010 | $0 | $0 |
| 2016 | $554 | $25,010 | $0 | $0 |
| 2015 | $554 | $25,010 | $0 | $0 |
| 2014 | $566 | $25,010 | $0 | $0 |
B
Seller's Agent in 2025
Brad Burke
Burke Real Estate
(507) 259-5070
14 in this area
22 Total Sales

Buyer's Agent in 2025
Steven Burke
Burke Real Estate
(507) 251-0644
32 in this area
59 Total Sales
Source: Northeast Iowa Regional Board of REALTORS®
MLS Number: NBR20252647
APN: 320-01-34-01-030-000
Disclaimer: Certain information contained herein is derived from information provided by parties other than Homes.com. All information provided is deemed reliable, but is not guaranteed to be accurate and should be independently verified.
![]() IDX information is provided exclusively for personal, non-commercial use, and may not be used for any purpose other than to identify prospective properties consumers may be interested in purchasing. Information is deemed reliable but not guaranteed.
IDX information is provided exclusively for personal, non-commercial use, and may not be used for any purpose other than to identify prospective properties consumers may be interested in purchasing. Information is deemed reliable but not guaranteed.