Estimated Value: $1,859,624 - $2,522,000
3
Beds
3
Baths
2,357
Sq Ft
$938/Sq Ft
Est. Value
About This Home
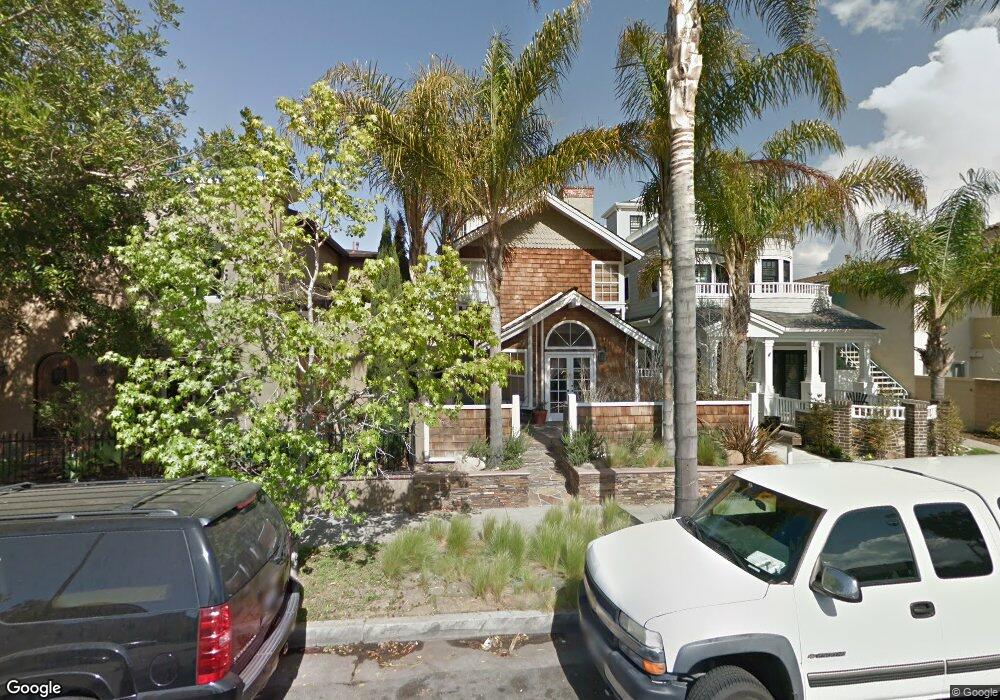
This home is located at 309 7th St, Huntington Beach, CA 92648 and is currently estimated at $2,211,406, approximately $938 per square foot. 309 7th St is a home located in Orange County with nearby schools including Agnes L. Smith Elementary, Ethel Dwyer Middle, and Huntington Beach High School.
Ownership History
Date
Name
Owned For
Owner Type
Purchase Details
Closed on
Dec 14, 2018
Sold by
Westland Bill and Westland Perri
Bought by
Westland Bill L and Westland Perri L
Current Estimated Value
Purchase Details
Closed on
Dec 12, 1998
Sold by
Kenneth Tippie and Kenneth Ann M
Bought by
Westland Bill and Westland Perri
Home Financials for this Owner
Home Financials are based on the most recent Mortgage that was taken out on this home.
Original Mortgage
$296,000
Outstanding Balance
$66,366
Interest Rate
6.63%
Estimated Equity
$2,145,040
Purchase Details
Closed on
Feb 21, 1995
Sold by
Winter Carol Ann
Bought by
Tippie Kenneth and Tippie Ann M
Home Financials for this Owner
Home Financials are based on the most recent Mortgage that was taken out on this home.
Original Mortgage
$189,000
Interest Rate
9.03%
Create a Home Valuation Report for This Property
The Home Valuation Report is an in-depth analysis detailing your home's value as well as a comparison with similar homes in the area
Home Values in the Area
Average Home Value in this Area
Purchase History
| Date | Buyer | Sale Price | Title Company |
|---|---|---|---|
| Westland Bill L | -- | None Available | |
| Westland Bill | $370,000 | Fidelity National Title Ins | |
| Tippie Kenneth | $319,000 | Continental Lawyers Title Co |
Source: Public Records
Mortgage History
| Date | Status | Borrower | Loan Amount |
|---|---|---|---|
| Open | Westland Bill | $296,000 | |
| Previous Owner | Tippie Kenneth | $189,000 |
Source: Public Records
Tax History Compared to Growth
Tax History
| Year | Tax Paid | Tax Assessment Tax Assessment Total Assessment is a certain percentage of the fair market value that is determined by local assessors to be the total taxable value of land and additions on the property. | Land | Improvement |
|---|---|---|---|---|
| 2025 | $6,585 | $580,046 | $339,346 | $240,700 |
| 2024 | $6,585 | $568,673 | $332,692 | $235,981 |
| 2023 | $6,435 | $557,523 | $326,169 | $231,354 |
| 2022 | $6,265 | $546,592 | $319,774 | $226,818 |
| 2021 | $6,148 | $535,875 | $313,504 | $222,371 |
| 2020 | $6,107 | $530,381 | $310,290 | $220,091 |
| 2019 | $6,034 | $519,982 | $304,206 | $215,776 |
| 2018 | $5,940 | $509,787 | $298,241 | $211,546 |
| 2017 | $5,860 | $499,792 | $292,393 | $207,399 |
| 2016 | $5,602 | $489,993 | $286,660 | $203,333 |
| 2015 | $5,547 | $482,633 | $282,354 | $200,279 |
| 2014 | $5,429 | $473,179 | $276,823 | $196,356 |
Source: Public Records
Map
Nearby Homes
- 309 8th St
- 316 6th St
- 517 Walnut Ave
- 308 5th St
- 221 10th St
- 711 Pacific Coast Hwy Unit 303
- 711 Pacific Coast Hwy Unit 330
- 711 Pacific Coast Hwy Unit 206
- 513 Pecan Ave
- 116 11th St
- 427 10th St
- 414 Main St Unit 400
- 414 Main St Unit 330
- 414 Main St Unit 430
- 414 Main St Unit 200
- 414 Main St Unit 420
- 1111 Olive Ave Unit A & B
- 1102 Pacific Coast Hwy Unit Lot 4
- 228 12th St Unit 1113 Olive Av
- 214 Walnut Ave