Estimated Value: $324,706 - $484,000
3
Beds
3
Baths
2,041
Sq Ft
$184/Sq Ft
Est. Value
About This Home
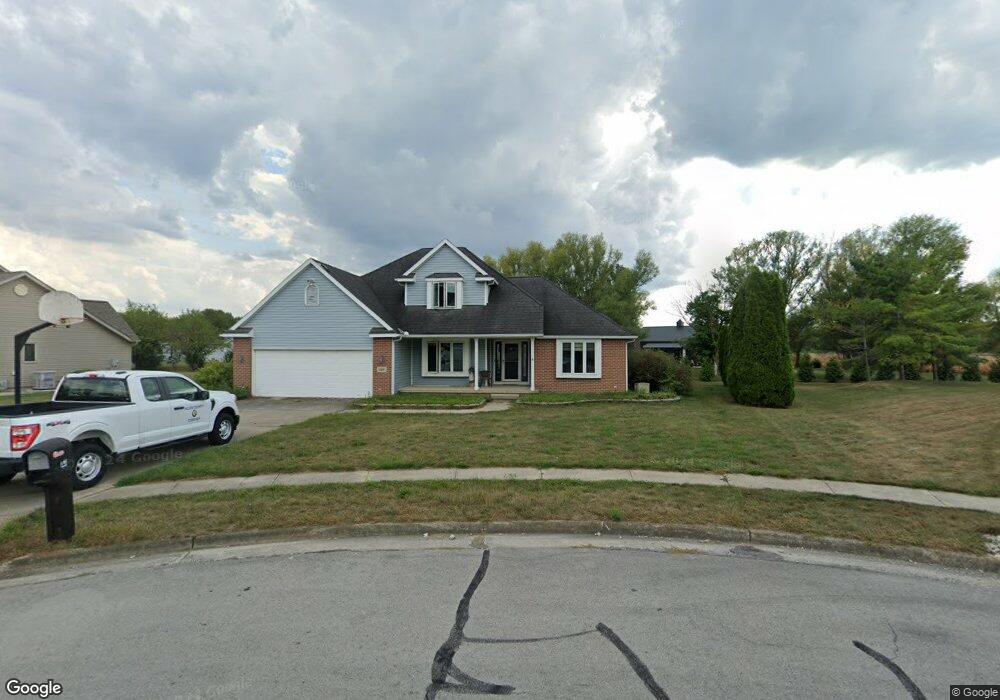
This home is located at 309 Cherry Blossom Ct, Lima, OH 45807 and is currently estimated at $374,677, approximately $183 per square foot. 309 Cherry Blossom Ct is a home located in Allen County with nearby schools including Elida Elementary School, Elida Middle School, and Elida High School.
Ownership History
Date
Name
Owned For
Owner Type
Purchase Details
Closed on
Apr 15, 2011
Sold by
Dillon Matthew R and Dillon Amber N
Bought by
Stewart Brian
Current Estimated Value
Home Financials for this Owner
Home Financials are based on the most recent Mortgage that was taken out on this home.
Original Mortgage
$197,853
Outstanding Balance
$133,920
Interest Rate
4.4%
Mortgage Type
FHA
Estimated Equity
$240,757
Purchase Details
Closed on
Apr 5, 2008
Sold by
Betsch Reinhold and Betsch Elizabeth M
Bought by
Dillon Matthew R and Dillon Amber N
Home Financials for this Owner
Home Financials are based on the most recent Mortgage that was taken out on this home.
Original Mortgage
$194,750
Interest Rate
6.1%
Mortgage Type
Purchase Money Mortgage
Purchase Details
Closed on
May 12, 1993
Bought by
Bowers Bowers F and Bowers Denise E
Create a Home Valuation Report for This Property
The Home Valuation Report is an in-depth analysis detailing your home's value as well as a comparison with similar homes in the area
Home Values in the Area
Average Home Value in this Area
Purchase History
| Date | Buyer | Sale Price | Title Company |
|---|---|---|---|
| Stewart Brian | $203,000 | Attorney | |
| Dillon Matthew R | $205,000 | Attorney | |
| Bowers Bowers F | $19,000 | -- |
Source: Public Records
Mortgage History
| Date | Status | Borrower | Loan Amount |
|---|---|---|---|
| Open | Stewart Brian | $197,853 | |
| Previous Owner | Dillon Matthew R | $194,750 |
Source: Public Records
Tax History Compared to Growth
Tax History
| Year | Tax Paid | Tax Assessment Tax Assessment Total Assessment is a certain percentage of the fair market value that is determined by local assessors to be the total taxable value of land and additions on the property. | Land | Improvement |
|---|---|---|---|---|
| 2024 | $3,966 | $81,800 | $7,880 | $73,920 |
| 2023 | $3,713 | $70,530 | $6,790 | $63,740 |
| 2022 | $4,823 | $70,530 | $6,790 | $63,740 |
| 2021 | $3,542 | $70,530 | $6,790 | $63,740 |
| 2020 | $3,817 | $63,420 | $6,440 | $56,980 |
| 2019 | $3,817 | $63,420 | $6,440 | $56,980 |
| 2018 | $4,207 | $63,420 | $6,440 | $56,980 |
| 2017 | $3,891 | $60,690 | $6,440 | $54,250 |
| 2016 | $8,006 | $60,690 | $6,440 | $54,250 |
| 2015 | $3,429 | $60,690 | $6,440 | $54,250 |
| 2014 | $3,429 | $62,580 | $6,440 | $56,140 |
| 2013 | $3,109 | $62,580 | $6,440 | $56,140 |
Source: Public Records
Map
Nearby Homes
- 3838 Kemp Rd N
- 3036 Whippoorwill Ave
- 2733 Lilly Dr
- 4723 Amaryllis St
- 5126 Pheasant St
- 2048 Morning Glory Dr
- 6726 Elida Rd
- 5103 Hummingbird St
- 4917 Pheasant St
- 5280 Lobo St
- 4901 Hummingbird St
- 4901 Lobo St
- 2568 Susan Ann Dr
- 4250 Diller Rd
- 4540 East Rd
- 0000 Diller Rd
- 3755 Grubb Rd N
- 1784 Woodberry Creek Dr
- 1734 Woodberry Creek Dr
- 0000 Baty Rd