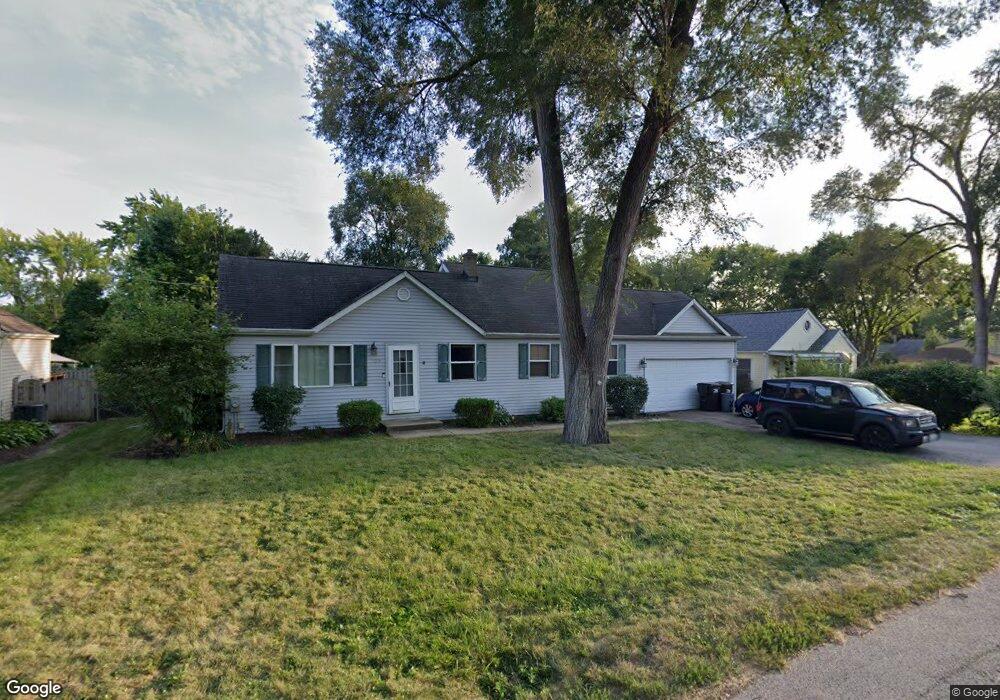
309 David Ct Island Lake, IL 60042
West Island Lake NeighborhoodEstimated Value: $260,000 - $317,000
3
Beds
4
Baths
1,132
Sq Ft
$258/Sq Ft
Est. Value
About This Home
This home is located at 309 David Ct, Island Lake, IL 60042 and is currently estimated at $292,217, approximately $258 per square foot. 309 David Ct is a home located in McHenry County with nearby schools including Edgebrook Elementary School, Chauncey H Duker School, and Mchenry Middle School.
Ownership History
Date
Name
Owned For
Owner Type
Purchase Details
Closed on
Oct 12, 2011
Sold by
Trocola Jon Paul and Trocola Michaelene
Bought by
Trocola Jon Paul and Trocola Michaelene G
Current Estimated Value
Home Financials for this Owner
Home Financials are based on the most recent Mortgage that was taken out on this home.
Original Mortgage
$143,889
Outstanding Balance
$98,232
Interest Rate
4.12%
Mortgage Type
FHA
Estimated Equity
$193,985
Purchase Details
Closed on
Feb 13, 2006
Sold by
Tyche Robert B and Tyche John W
Bought by
Tyche John W
Purchase Details
Closed on
Apr 10, 2003
Sold by
Giannini Tony
Bought by
Trocola Jon Paul and Gerster Michaelene
Home Financials for this Owner
Home Financials are based on the most recent Mortgage that was taken out on this home.
Original Mortgage
$163,650
Interest Rate
5.87%
Mortgage Type
FHA
Purchase Details
Closed on
Feb 28, 2002
Sold by
Allison Lloyd F
Bought by
Giannini Tony
Purchase Details
Closed on
Mar 27, 2001
Sold by
Thomson Lindola A and Thomson Thomas L
Bought by
Allison Esther L
Create a Home Valuation Report for This Property
The Home Valuation Report is an in-depth analysis detailing your home's value as well as a comparison with similar homes in the area
Home Values in the Area
Average Home Value in this Area
Purchase History
| Date | Buyer | Sale Price | Title Company |
|---|---|---|---|
| Trocola Jon Paul | -- | Fatic | |
| Tyche John W | -- | None Available | |
| Trocola Jon Paul | $166,250 | Ticor | |
| Giannini Tony | $96,000 | Multiple | |
| Allison Esther L | -- | -- |
Source: Public Records
Mortgage History
| Date | Status | Borrower | Loan Amount |
|---|---|---|---|
| Open | Trocola Jon Paul | $143,889 | |
| Closed | Trocola Jon Paul | $163,650 |
Source: Public Records
Tax History Compared to Growth
Tax History
| Year | Tax Paid | Tax Assessment Tax Assessment Total Assessment is a certain percentage of the fair market value that is determined by local assessors to be the total taxable value of land and additions on the property. | Land | Improvement |
|---|---|---|---|---|
| 2024 | $6,179 | $78,723 | $21,685 | $57,038 |
| 2023 | $5,947 | $70,598 | $19,447 | $51,151 |
| 2022 | $5,740 | $64,561 | $17,784 | $46,777 |
| 2021 | $5,480 | $60,530 | $16,674 | $43,856 |
| 2020 | $4,874 | $53,596 | $15,173 | $38,423 |
| 2019 | $4,734 | $50,957 | $14,426 | $36,531 |
| 2018 | $4,869 | $47,865 | $13,551 | $34,314 |
| 2017 | $4,752 | $45,856 | $12,982 | $32,874 |
| 2016 | $4,668 | $43,751 | $12,386 | $31,365 |
Source: Public Records
Map
Nearby Homes
- 318 David Ct
- 404 Lauren Ln
- lot 23 Park Dr
- NEC Route 176 & Westridge Dr
- 236 Forest Dr
- 244 Red Oak Ct
- 216 S Shore Dr Unit S
- 228 S Shore Dr
- 811 Newport Dr
- 2610 S Thomas Ct
- 3819 Woodlawn Dr
- 2448 Fen View Cir
- 3625 Newport Dr
- Lot 12 W Northeast Shore Dr
- Lot 11 W Northeast Shore Dr
- Lot 10 W Northeast Shore Dr
- Lot 9 W Northeast Shore Dr
- Lot 8 W Northeast Shore Dr
- Lot 7 W Northeast Shore Dr
- Lot 4 W Northeast Shore Dr