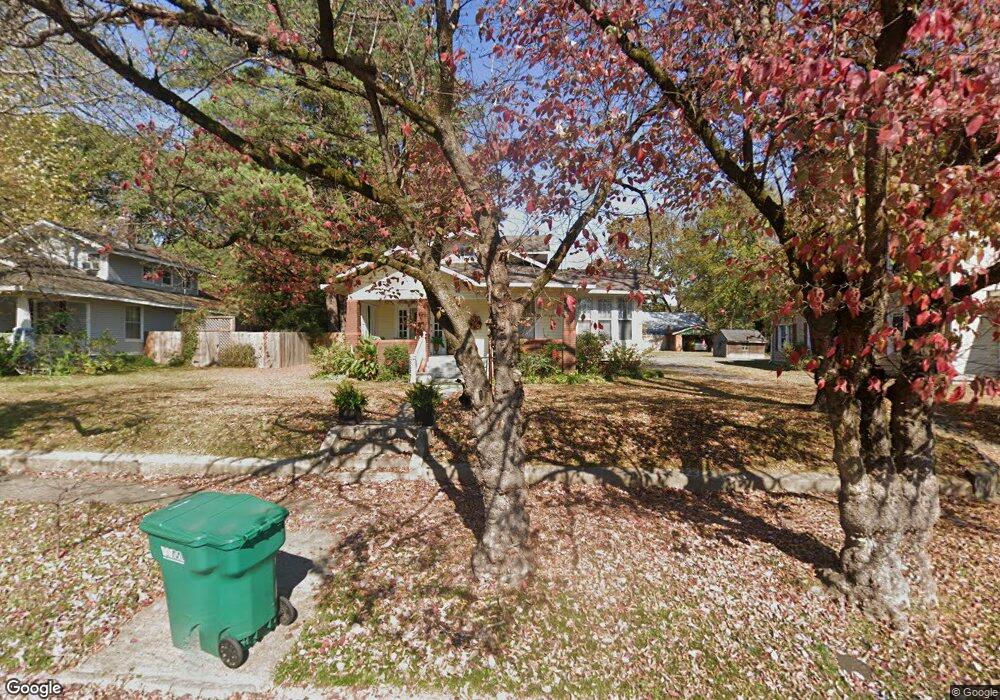
309 Division Ave Jackson, TN 38301
Estimated Value: $103,725 - $152,000
Studio
1
Bath
1,532
Sq Ft
$88/Sq Ft
Est. Value
About This Home
This home is located at 309 Division Ave, Jackson, TN 38301 and is currently estimated at $134,431, approximately $87 per square foot. 309 Division Ave is a home located in Madison County with nearby schools including Alexander Elementary School, North Parkway Middle School, and South Side High School.
Ownership History
Date
Name
Owned For
Owner Type
Purchase Details
Closed on
Oct 20, 2021
Sold by
Millson Thomas
Bought by
Millson Thomas and Benton Mark
Current Estimated Value
Purchase Details
Closed on
Sep 12, 2006
Sold by
Etal Fowler Heather
Bought by
Millson Thomas M
Home Financials for this Owner
Home Financials are based on the most recent Mortgage that was taken out on this home.
Original Mortgage
$15,200
Interest Rate
6.52%
Purchase Details
Closed on
Apr 3, 2006
Sold by
Sec Of Hud
Bought by
Heather Fowler
Home Financials for this Owner
Home Financials are based on the most recent Mortgage that was taken out on this home.
Original Mortgage
$40,500
Interest Rate
6.23%
Purchase Details
Closed on
Nov 28, 2005
Sold by
Tennessee Housing Dev Agen
Bought by
Sec Of Hud
Purchase Details
Closed on
Nov 14, 2005
Sold by
Jones J Phillip Sub Tr
Bought by
Tennessee Housing Dev Agency
Purchase Details
Closed on
Oct 27, 1989
Bought by
Greer Bonnie L
Purchase Details
Closed on
May 9, 1986
Create a Home Valuation Report for This Property
The Home Valuation Report is an in-depth analysis detailing your home's value as well as a comparison with similar homes in the area
Purchase History
| Date | Buyer | Sale Price | Title Company |
|---|---|---|---|
| Millson Thomas | -- | None Available | |
| Millson Thomas M | $76,000 | -- | |
| Heather Fowler | $45,000 | -- | |
| Sec Of Hud | -- | -- | |
| Tennessee Housing Dev Agency | -- | -- | |
| Greer Bonnie L | $47,000 | -- | |
| -- | $44,000 | -- |
Source: Public Records
Mortgage History
| Date | Status | Borrower | Loan Amount |
|---|---|---|---|
| Closed | Not Available | $15,200 | |
| Previous Owner | Not Available | $40,500 |
Source: Public Records
Tax History
| Year | Tax Paid | Tax Assessment Tax Assessment Total Assessment is a certain percentage of the fair market value that is determined by local assessors to be the total taxable value of land and additions on the property. | Land | Improvement |
|---|---|---|---|---|
| 2025 | $340 | $20,075 | $3,425 | $16,650 |
| 2024 | $340 | $18,150 | $3,425 | $14,725 |
| 2022 | $632 | $18,150 | $3,425 | $14,725 |
| 2021 | $521 | $12,075 | $2,325 | $9,750 |
| 2020 | $521 | $12,075 | $2,325 | $9,750 |
| 2019 | $521 | $12,075 | $2,325 | $9,750 |
| 2018 | $521 | $12,075 | $2,325 | $9,750 |
| 2017 | $493 | $11,175 | $2,325 | $8,850 |
| 2016 | $459 | $11,175 | $2,325 | $8,850 |
| 2015 | $460 | $11,175 | $2,325 | $8,850 |
| 2014 | $460 | $11,175 | $2,325 | $8,850 |
Source: Public Records
Map
Nearby Homes
- 161 W Grand St
- 915 N Highland Ave
- 425 Arlington Ave
- 431 Arlington Ave
- 119 Otis St
- 218 W King St
- 225 Linden St
- 111 Westwood Ave
- 3 Northwood Ave
- 523 Westmoreland Place
- 426 W King St
- 337 Linden St
- 1072 N Highland Ave Unit 10
- 326 Walnut St
- 222 Elm St
- 22 Sunset Ave
- 119 Fairmont Ave
- 205 McCowat St
- 568 Westmoreland Place
- 214 McCowat St
- 305 Division Ave
- 315 Division Ave
- 321 Division Ave
- 170 Wisdom St
- 172 Wisdom St
- 168 Wisdom St
- 174 Wisdom St
- 223 Division Ave
- 323 Division Ave
- 176 Wisdom St
- 308 Division Ave
- 312 Division Ave
- 304 Division Ave
- 316 Division Ave
- 178 Wisdom St
- 215 Division Ave
- 322 Division Ave
- 324 Division Ave
- 211 Division Ave
- 331 Division Ave
Your Personal Tour Guide
Ask me questions while you tour the home.