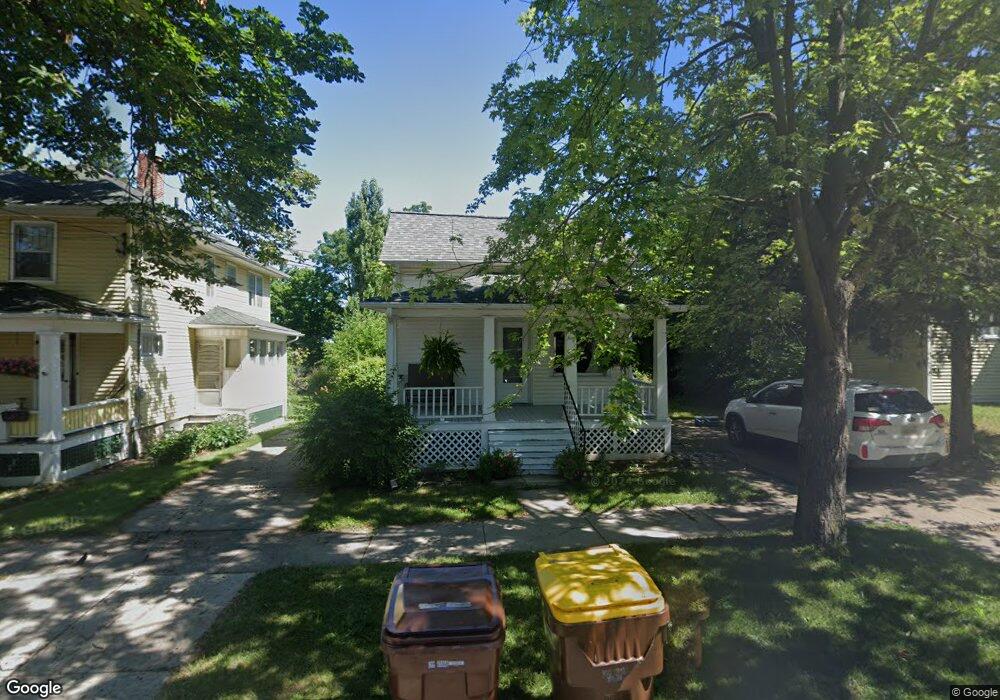
309 E Higham St Saint Johns, MI 48879
Estimated Value: $159,000 - $199,000
3
Beds
1
Bath
1,280
Sq Ft
$135/Sq Ft
Est. Value
About This Home
This home is located at 309 E Higham St, Saint Johns, MI 48879 and is currently estimated at $172,916, approximately $135 per square foot. 309 E Higham St is a home located in Clinton County with nearby schools including St. Johns High School and St Joseph Catholic School.
Ownership History
Date
Name
Owned For
Owner Type
Purchase Details
Closed on
Jul 15, 2020
Sold by
Armbrustmacher Joan M
Bought by
Cooper Jeremy J
Current Estimated Value
Purchase Details
Closed on
Feb 20, 2013
Sold by
Milton Marcus M
Bought by
Armbrustmacher Joan M
Purchase Details
Closed on
Feb 4, 2013
Sold by
Secretary Of Housing & Urban Development
Bought by
Milton Marcus
Purchase Details
Closed on
Apr 23, 2012
Sold by
Flagstar Bank Fsb
Bought by
The Secretary Of Housing & Urban Develop
Purchase Details
Closed on
Jun 29, 2010
Sold by
Mortgage Electronic Registration Systems
Bought by
Flagstar Bank Fsb
Purchase Details
Closed on
Jun 23, 2010
Sold by
Vince Kelly Holmes
Bought by
Mortgage Electronic Registration Systems
Purchase Details
Closed on
Sep 7, 2006
Sold by
Kus Mary Anne and Kus Mary Ann
Bought by
Holmes Vince Kelly
Home Financials for this Owner
Home Financials are based on the most recent Mortgage that was taken out on this home.
Original Mortgage
$109,038
Interest Rate
6.7%
Mortgage Type
FHA
Create a Home Valuation Report for This Property
The Home Valuation Report is an in-depth analysis detailing your home's value as well as a comparison with similar homes in the area
Home Values in the Area
Average Home Value in this Area
Purchase History
We collect this data history from publicly available records. To have your information removed, we recommend requesting removal directly through your county’s website.
| Date | Buyer | Sale Price | Title Company |
|---|---|---|---|
| Cooper Jeremy J | -- | None Available | |
| Armbrustmacher Joan M | -- | None Available | |
| Milton Marcus | $26,750 | None Available | |
| The Secretary Of Housing & Urban Develop | -- | None Available | |
| Flagstar Bank Fsb | -- | None Available | |
| Mortgage Electronic Registration Systems | $119,451 | None Available | |
| Holmes Vince Kelly | $109,900 | Fatic |
Source: Public Records
Mortgage History
We collect this data history from publicly available records. To have your information removed, we recommend requesting removal directly through your county’s website.
| Date | Status | Borrower | Loan Amount |
|---|---|---|---|
| Previous Owner | Holmes Vince Kelly | $109,038 |
Source: Public Records
Tax History
| Year | Tax Paid | Tax Assessment Tax Assessment Total Assessment is a certain percentage of the fair market value that is determined by local assessors to be the total taxable value of land and additions on the property. | Land | Improvement |
|---|---|---|---|---|
| 2025 | $2,035 | $58,500 | $15,000 | $43,500 |
| 2024 | $10 | $55,000 | $15,000 | $40,000 |
| 2023 | $988 | $50,600 | $0 | $0 |
| 2022 | $1,845 | $43,200 | $13,100 | $30,100 |
| 2021 | $1,790 | $39,000 | $11,300 | $27,700 |
| 2020 | $1,737 | $36,600 | $10,300 | $26,300 |
| 2019 | $1,699 | $35,400 | $10,300 | $25,100 |
| 2018 | $1,573 | $34,600 | $10,300 | $24,300 |
| 2017 | -- | $34,900 | $10,300 | $24,600 |
| 2016 | -- | $33,000 | $8,700 | $24,300 |
| 2015 | -- | $31,000 | $0 | $0 |
| 2011 | -- | $35,000 | $0 | $0 |
Source: Public Records
Map
Nearby Homes
- 100 N Oakland St
- 505 E Walker St
- 510 N Mead St
- 1455 W Hyde Rd
- 123 N Clinton Ave
- 111 W Steel St
- 207 E Mcconnell St
- 705 N Us127
- 207 S Traver St
- 502 W State St
- 109 Lewis St
- 603 S Clinton Ave
- 909 N Clinton Ave
- 209 S Emmons St
- 600 S Church St
- 8415 Church St
- 605 S Kibbee St
- 608 N Morton St
- 810 Joyce Ln
- 808 Joyce Ln
- 309 E Higham St St
- 311 E Higham St
- 313 & 311 E Higham St
- 307 E Higham St
- 305 E Higham St
- 313 E Higham St
- 311 & 313 E Higham St
- 306 N Oakland St
- 303 E Higham St
- 306 S Oakland St
- 306 E Railroad St
- 301 E Higham St
- 304 E Railroad St
- 306 E Higham St
- 302 E Railroad St
- 308 N Oakland St
- 300 E Higham St
- 401 E Higham St
- 207 N Mead St
- 300 E Railroad St
Your Personal Tour Guide
Ask me questions while you tour the home.