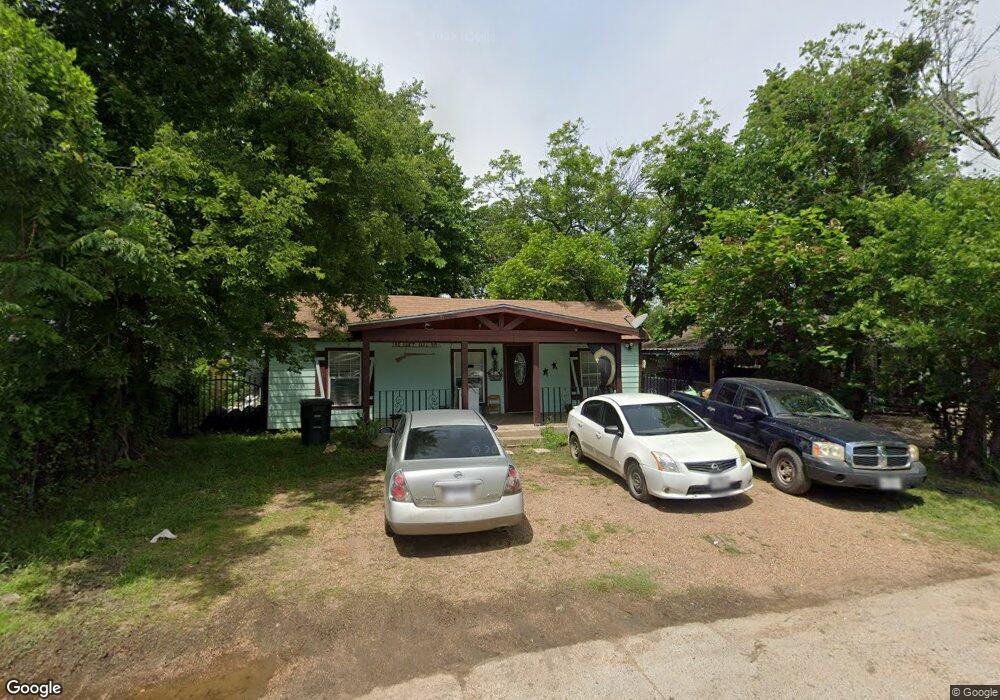
309 Evans St Cleburne, TX 76031
Estimated Value: $119,044 - $159,000
2
Beds
1
Bath
814
Sq Ft
$168/Sq Ft
Est. Value
About This Home
This home is located at 309 Evans St, Cleburne, TX 76031 and is currently estimated at $136,761, approximately $168 per square foot. 309 Evans St is a home located in Johnson County with nearby schools including Irving Elementary School, A.D. Wheat Middle School, and Cleburne High School.
Ownership History
Date
Name
Owned For
Owner Type
Purchase Details
Closed on
Jul 22, 2017
Sold by
Fernandez Laura I
Bought by
Zapata Sosa Jose Antonio
Current Estimated Value
Purchase Details
Closed on
Jul 5, 2012
Sold by
Fernandez Laura Irene and Sanchez Antonio
Bought by
Fernandez Laura Irene
Purchase Details
Closed on
Nov 18, 2005
Sold by
Delapaz Jerardo and De Lapaz Liliana
Bought by
Sanchez Antonio and Delacruz Maria Elizabeth
Home Financials for this Owner
Home Financials are based on the most recent Mortgage that was taken out on this home.
Original Mortgage
$15,500
Interest Rate
6.06%
Mortgage Type
Seller Take Back
Create a Home Valuation Report for This Property
The Home Valuation Report is an in-depth analysis detailing your home's value as well as a comparison with similar homes in the area
Home Values in the Area
Average Home Value in this Area
Purchase History
| Date | Buyer | Sale Price | Title Company |
|---|---|---|---|
| Zapata Sosa Jose Antonio | -- | None Available | |
| Fernandez Laura Irene | -- | None Available | |
| Sanchez Antonio | -- | None Available |
Source: Public Records
Mortgage History
| Date | Status | Borrower | Loan Amount |
|---|---|---|---|
| Previous Owner | Sanchez Antonio | $15,500 |
Source: Public Records
Tax History
| Year | Tax Paid | Tax Assessment Tax Assessment Total Assessment is a certain percentage of the fair market value that is determined by local assessors to be the total taxable value of land and additions on the property. | Land | Improvement |
|---|---|---|---|---|
| 2025 | $1,900 | $90,524 | $43,000 | $47,524 |
| 2024 | $1,900 | $85,229 | $0 | $0 |
| 2023 | $1,580 | $71,024 | $23,500 | $47,524 |
| 2022 | $1,777 | $71,024 | $23,500 | $47,524 |
| 2021 | $1,853 | $71,024 | $23,500 | $47,524 |
| 2020 | $1,235 | $44,559 | $20,000 | $24,559 |
| 2019 | $1,317 | $44,559 | $20,000 | $24,559 |
| 2018 | $948 | $32,059 | $7,500 | $24,559 |
| 2017 | $944 | $32,059 | $7,500 | $24,559 |
| 2016 | $944 | $32,059 | $7,500 | $24,559 |
Source: Public Records
Map
Nearby Homes
- 316 Liberty St
- 206 Hix Rd
- 1205 Boone St
- 1109 Chase Ave
- 211 Huron St
- 1103 Chase Ave
- 610 Erie St
- 222 Hix Rd
- 707 Cedar St
- 1802 N Wilhite St
- 812 Barber Ave
- 1210 N Robinson St
- 1313 N Robinson St
- 1512 N Anglin St
- 301 Eastland St
- 1609 N Brazos Ave
- 1019 N Anglin St
- 906 N Wilhite St
- 1612 N Anglin St
- 110 Ramsey Ave
Your Personal Tour Guide
Ask me questions while you tour the home.