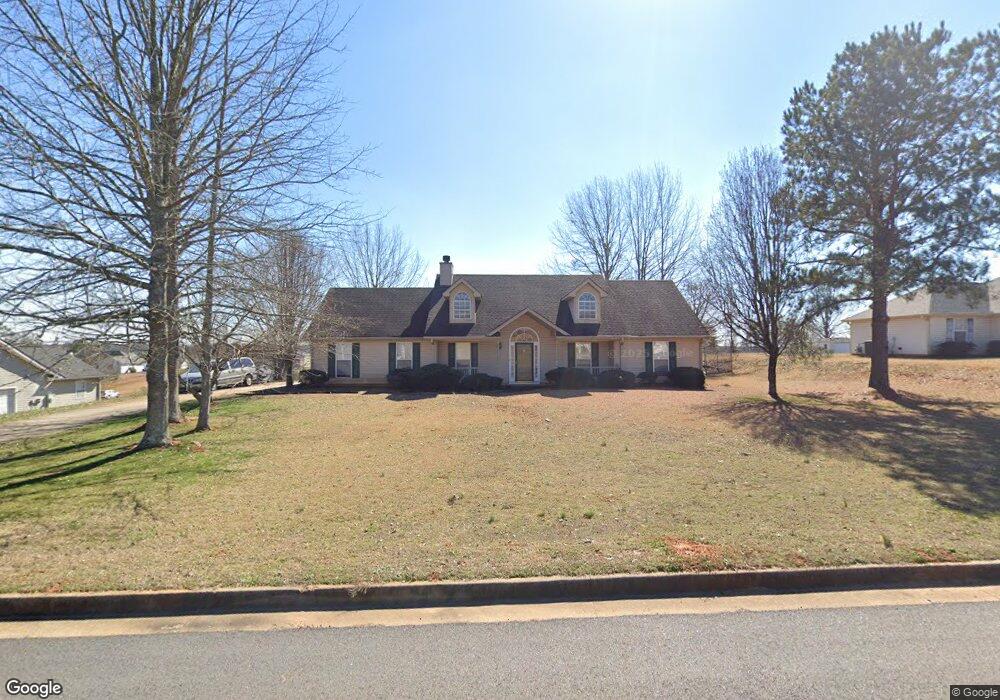
309 Harris Ave Unit 2 Locust Grove, GA 30248
Estimated Value: $253,000 - $281,000
3
Beds
2
Baths
1,431
Sq Ft
$185/Sq Ft
Est. Value
About This Home
This home is located at 309 Harris Ave Unit 2, Locust Grove, GA 30248 and is currently estimated at $265,314, approximately $185 per square foot. 309 Harris Ave Unit 2 is a home located in Henry County with nearby schools including Locust Grove Elementary School, Locust Grove Middle School, and Locust Grove High School.
Ownership History
Date
Name
Owned For
Owner Type
Purchase Details
Closed on
Dec 31, 2024
Sold by
Clinkenbeard Margaret J
Bought by
Henderson Kenneth Robin
Current Estimated Value
Purchase Details
Closed on
Nov 8, 2024
Sold by
Henderson Barry Lane
Bought by
Clinkenbeard Margaret J
Purchase Details
Closed on
Oct 15, 2024
Sold by
Carothers Vicki Henderson
Bought by
Clinkenbeard Margaret J
Purchase Details
Closed on
Oct 21, 2011
Sold by
Henderson Kenneth Robin
Bought by
Clinkenbeard Margaret Jacqueli and Henderson Barry Lane
Purchase Details
Closed on
Jun 2, 2009
Sold by
Henderson Lester C
Bought by
Clinkenbeard Margret J and Henderson Kenneth
Purchase Details
Closed on
Sep 30, 2005
Sold by
Kernell Clay W
Bought by
Henderson Lester C
Purchase Details
Closed on
Nov 17, 2000
Sold by
Brenco Inc
Bought by
Kernell Clay W
Home Financials for this Owner
Home Financials are based on the most recent Mortgage that was taken out on this home.
Original Mortgage
$110,500
Interest Rate
7.79%
Mortgage Type
FHA
Create a Home Valuation Report for This Property
The Home Valuation Report is an in-depth analysis detailing your home's value as well as a comparison with similar homes in the area
Home Values in the Area
Average Home Value in this Area
Purchase History
| Date | Buyer | Sale Price | Title Company |
|---|---|---|---|
| Henderson Kenneth Robin | -- | -- | |
| Clinkenbeard Margaret J | -- | -- | |
| Clinkenbeard Margaret J | -- | -- | |
| Clinkenbeard Margaret Jacqueli | -- | -- | |
| Clinkenbeard Margret J | -- | -- | |
| Henderson Lester C | $123,000 | -- | |
| Kernell Clay W | $108,000 | -- |
Source: Public Records
Mortgage History
| Date | Status | Borrower | Loan Amount |
|---|---|---|---|
| Previous Owner | Kernell Clay W | $110,500 |
Source: Public Records
Tax History Compared to Growth
Tax History
| Year | Tax Paid | Tax Assessment Tax Assessment Total Assessment is a certain percentage of the fair market value that is determined by local assessors to be the total taxable value of land and additions on the property. | Land | Improvement |
|---|---|---|---|---|
| 2025 | $38 | $102,680 | $14,000 | $88,680 |
| 2024 | $38 | $93,480 | $14,000 | $79,480 |
| 2023 | $3,877 | $106,920 | $14,000 | $92,920 |
| 2022 | $3,035 | $82,920 | $14,000 | $68,920 |
| 2021 | $2,483 | $67,520 | $14,000 | $53,520 |
| 2020 | $2,240 | $60,800 | $12,000 | $48,800 |
| 2019 | $1,993 | $53,120 | $12,000 | $41,120 |
| 2018 | $1,895 | $50,800 | $10,800 | $40,000 |
| 2016 | $1,811 | $46,160 | $10,000 | $36,160 |
| 2015 | -- | $42,800 | $10,000 | $32,800 |
| 2014 | $1,588 | $38,680 | $12,000 | $26,680 |
Source: Public Records
Map
Nearby Homes
- 231 Ferguson Ave
- 239 Ferguson Ave
- 143 Massey Ln
- 1064 Lear Dr
- 565 Carleton Place
- 150 Aster Ave
- Cali Plan at Cedar Ridge - Locust Grove Station
- Belfort Plan at Cedar Ridge - Locust Grove Station
- Galen Plan at Cedar Ridge - Locust Grove Station
- Hayden Plan at Cedar Ridge - Locust Grove Station
- Packard Plan at Cedar Ridge - Locust Grove Station
- Flora Plan at Cedar Ridge - Locust Grove Station
- Penwell Plan at Cedar Ridge - Locust Grove Station
- 269 Baumgard Way
- 188 Sophie Cir
- 1134 Saint Phillips Ct
- 1119 Saint Phillips Ct
- 501 Vervain Dr
- 134 Aster Ave
- 505 Vervain Dr
- 311 Harris Ave
- 307 Harris Ave
- 234 Ferguson Ave
- 313 Harris Ave
- 232 Ferguson Ave
- 305 Harris Ave
- 308 Harris Ave
- 236 Ferguson Ave
- 310 Harris Ave
- 230 Ferguson Ave
- 306 Harris Ave
- 312 Harris Ave
- 315 Harris Ave
- 238 Ferguson Ave
- 228 Ferguson Ave
- 0 Ferguson Ave Unit 8584381
- 0 Ferguson Ave Unit 8581865
- 0 Ferguson Ave Unit 8557993
- 0 Ferguson Ave Unit 8308495
- 0 Ferguson Ave Unit 8264733