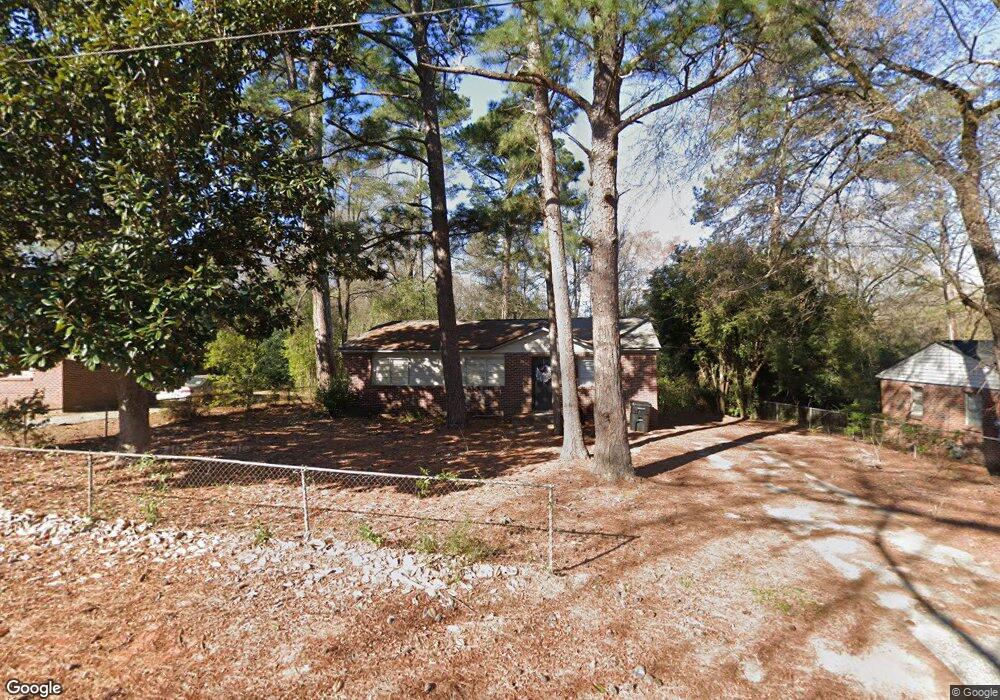
309 Johns Rd Warner Robins, GA 31093
Estimated Value: $97,040 - $123,000
3
Beds
1
Bath
984
Sq Ft
$110/Sq Ft
Est. Value
About This Home
This home is located at 309 Johns Rd, Warner Robins, GA 31093 and is currently estimated at $108,010, approximately $109 per square foot. 309 Johns Rd is a home located in Houston County with nearby schools including Northside Elementary School, Northside Middle School, and Northside High School.
Ownership History
Date
Name
Owned For
Owner Type
Purchase Details
Closed on
Jun 28, 2022
Sold by
Nyahwa Properties Llc
Bought by
Sfr3-080 Llc
Current Estimated Value
Purchase Details
Closed on
Jul 17, 2002
Sold by
Secretary Of Hs & Urban Dev
Bought by
Morris Richard A
Purchase Details
Closed on
Mar 5, 2002
Sold by
Washington Mutual Home Loans I
Bought by
Secretary Of Hs & Urban Dev
Purchase Details
Closed on
Feb 4, 1999
Bought by
Thomas Tracy
Purchase Details
Closed on
Jun 9, 1992
Sold by
City Of Warner
Bought by
Family Support Alliance For
Create a Home Valuation Report for This Property
The Home Valuation Report is an in-depth analysis detailing your home's value as well as a comparison with similar homes in the area
Home Values in the Area
Average Home Value in this Area
Purchase History
| Date | Buyer | Sale Price | Title Company |
|---|---|---|---|
| Sfr3-080 Llc | $49,000 | Burgess Title | |
| Nyahwa Properties Llc | $38,700 | Burgess Title | |
| Morris Richard A | $26,200 | -- | |
| Secretary Of Hs & Urban Dev | -- | -- | |
| Washington Mutual Home Loans Inc | -- | -- | |
| Thomas Tracy | -- | -- | |
| Family Support Alliance For | -- | -- |
Source: Public Records
Tax History
| Year | Tax Paid | Tax Assessment Tax Assessment Total Assessment is a certain percentage of the fair market value that is determined by local assessors to be the total taxable value of land and additions on the property. | Land | Improvement |
|---|---|---|---|---|
| 2024 | $1,154 | $35,280 | $5,000 | $30,280 |
| 2023 | $628 | $19,040 | $2,680 | $16,360 |
| 2022 | $333 | $14,480 | $2,680 | $11,800 |
| 2021 | $288 | $12,440 | $2,680 | $9,760 |
| 2020 | $307 | $13,200 | $2,680 | $10,520 |
| 2019 | $307 | $13,200 | $2,680 | $10,520 |
| 2018 | $307 | $13,200 | $2,680 | $10,520 |
| 2017 | $307 | $13,200 | $2,680 | $10,520 |
| 2016 | $307 | $13,200 | $2,680 | $10,520 |
| 2015 | -- | $13,200 | $2,680 | $10,520 |
| 2014 | -- | $13,200 | $2,680 | $10,520 |
| 2013 | -- | $14,760 | $2,680 | $12,080 |
Source: Public Records
Map
Nearby Homes
- 300 Ward St
- 102 Oregon Ct
- 220 Francis St
- 249 Ward St
- 239 Ward St
- 302 Dunmurry Place
- 100 Mauldon Ct
- 405 Dunmurry Place
- 108 Smith Place
- 212 Dunmurry Place
- 100 Silas Ct
- 213 King Dr
- 437 Dunmurry Place
- 202 Elmwood St
- 302 Hawaii Ave
- 714 Camellia Cir
- 111 Wisconsin Ave
- 102 Camellia Cir
- 145 Northsky Dr
- 427 Alabama Ave
Your Personal Tour Guide
Ask me questions while you tour the home.