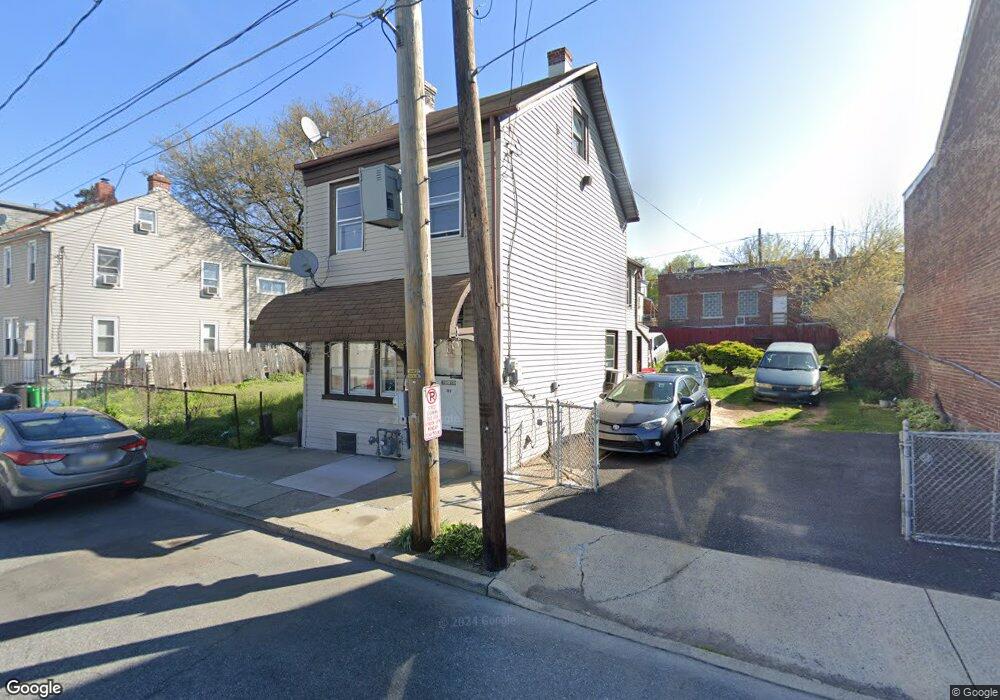
309 N 3rd St Unit 311 Allentown, PA 18102
1st Ward NeighborhoodEstimated Value: $140,000 - $175,000
3
Beds
1
Bath
1,306
Sq Ft
$114/Sq Ft
Est. Value
About This Home
This home is located at 309 N 3rd St Unit 311, Allentown, PA 18102 and is currently estimated at $149,371, approximately $114 per square foot. 309 N 3rd St Unit 311 is a home located in Lehigh County with nearby schools including Sheridan Elementary School, Harrison-Morton Middle School, and Louis E. Dieruff High School.
Ownership History
Date
Name
Owned For
Owner Type
Purchase Details
Closed on
Jun 11, 2004
Sold by
Dejesus Efrain and Dejesus Virginia
Bought by
Hernandez Jose M and Hernandez Benardina
Current Estimated Value
Home Financials for this Owner
Home Financials are based on the most recent Mortgage that was taken out on this home.
Original Mortgage
$64,592
Outstanding Balance
$31,554
Interest Rate
5.99%
Mortgage Type
FHA
Estimated Equity
$117,817
Purchase Details
Closed on
Oct 21, 1980
Bought by
Dejesus Efrain and Virginia Aponte
Create a Home Valuation Report for This Property
The Home Valuation Report is an in-depth analysis detailing your home's value as well as a comparison with similar homes in the area
Home Values in the Area
Average Home Value in this Area
Purchase History
| Date | Buyer | Sale Price | Title Company |
|---|---|---|---|
| Hernandez Jose M | $65,000 | Penntitle Inc | |
| Dejesus Efrain | $27,000 | -- |
Source: Public Records
Mortgage History
| Date | Status | Borrower | Loan Amount |
|---|---|---|---|
| Open | Hernandez Jose M | $64,592 |
Source: Public Records
Tax History Compared to Growth
Tax History
| Year | Tax Paid | Tax Assessment Tax Assessment Total Assessment is a certain percentage of the fair market value that is determined by local assessors to be the total taxable value of land and additions on the property. | Land | Improvement |
|---|---|---|---|---|
| 2025 | $1,566 | $47,500 | $5,200 | $42,300 |
| 2024 | $1,566 | $47,500 | $5,200 | $42,300 |
| 2023 | $1,566 | $47,500 | $5,200 | $42,300 |
| 2022 | $1,512 | $47,500 | $42,300 | $5,200 |
| 2021 | $1,482 | $47,500 | $5,200 | $42,300 |
| 2020 | $1,444 | $47,500 | $5,200 | $42,300 |
| 2019 | $1,421 | $47,500 | $5,200 | $42,300 |
| 2018 | $1,323 | $47,500 | $5,200 | $42,300 |
| 2017 | $1,290 | $47,500 | $5,200 | $42,300 |
| 2016 | -- | $47,500 | $5,200 | $42,300 |
| 2015 | -- | $47,500 | $5,200 | $42,300 |
| 2014 | -- | $47,500 | $5,200 | $42,300 |
Source: Public Records
Map
Nearby Homes