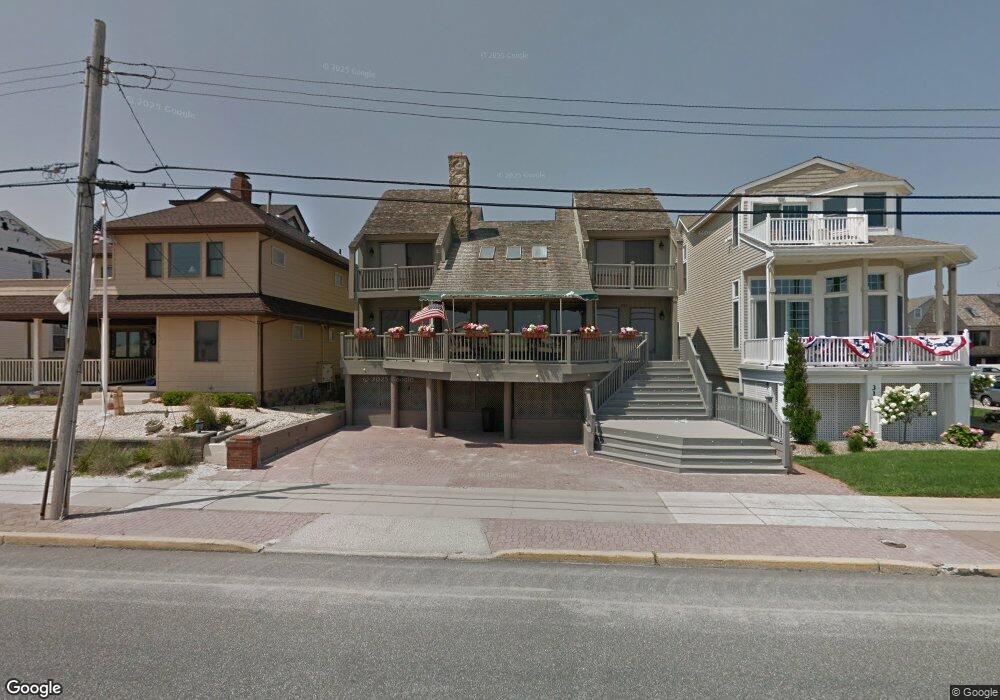
309 N Ocean Ave Unit 11 Seaside Park, NJ 08752
Estimated Value: $2,380,554 - $2,920,000
4
Beds
4
Baths
3,552
Sq Ft
$720/Sq Ft
Est. Value
About This Home
This home is located at 309 N Ocean Ave Unit 11, Seaside Park, NJ 08752 and is currently estimated at $2,556,389, approximately $719 per square foot. 309 N Ocean Ave Unit 11 is a home located in Ocean County with nearby schools including Central Regional Middle School and Central Regional High School.
Ownership History
Date
Name
Owned For
Owner Type
Purchase Details
Closed on
Jun 7, 2022
Sold by
Josephine Pontone
Bought by
Bythell Andrew and Bythell Barbara
Current Estimated Value
Purchase Details
Closed on
Jun 16, 2011
Sold by
Pontone Louis and Pontone Josephine
Bought by
Pontone Louis and Pontone Josephine
Purchase Details
Closed on
Nov 19, 2005
Sold by
Casement Don J
Bought by
Casement Don J and Chirichillo Lisa A
Create a Home Valuation Report for This Property
The Home Valuation Report is an in-depth analysis detailing your home's value as well as a comparison with similar homes in the area
Home Values in the Area
Average Home Value in this Area
Purchase History
| Date | Buyer | Sale Price | Title Company |
|---|---|---|---|
| Bythell Andrew | $2,100,000 | Sage Title & Settlement Servic | |
| Pontone Louis | -- | Lawyers Title Insurance Corp | |
| Casement Don J | -- | -- |
Source: Public Records
Tax History Compared to Growth
Tax History
| Year | Tax Paid | Tax Assessment Tax Assessment Total Assessment is a certain percentage of the fair market value that is determined by local assessors to be the total taxable value of land and additions on the property. | Land | Improvement |
|---|---|---|---|---|
| 2025 | $21,646 | $1,323,100 | $1,015,500 | $307,600 |
| 2024 | $21,289 | $1,323,100 | $1,015,500 | $307,600 |
| 2023 | $20,535 | $1,323,100 | $1,015,500 | $307,600 |
| 2022 | $20,535 | $1,323,100 | $1,015,500 | $307,600 |
| 2021 | $20,098 | $1,323,100 | $1,015,500 | $307,600 |
| 2020 | $19,886 | $1,323,100 | $1,015,500 | $307,600 |
| 2019 | $19,675 | $1,323,100 | $1,015,500 | $307,600 |
| 2018 | $18,391 | $1,323,100 | $1,015,500 | $307,600 |
| 2017 | $18,669 | $1,323,100 | $1,015,500 | $307,600 |
| 2016 | $17,359 | $1,323,100 | $1,015,500 | $307,600 |
| 2015 | $18,113 | $1,323,100 | $1,015,500 | $307,600 |
| 2014 | $17,306 | $1,323,100 | $1,015,500 | $307,600 |
Source: Public Records
Map
Nearby Homes