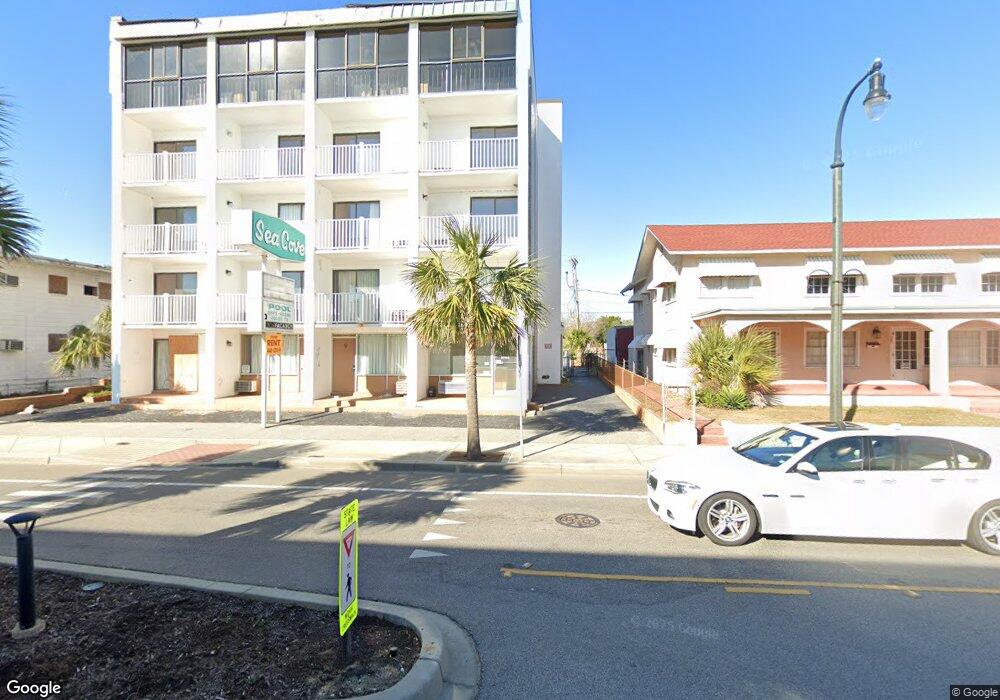
309 N Ocean Blvd Myrtle Beach, SC 29577
Downtown Myrtle Beach NeighborhoodEstimated Value: $424,000 - $496,532
3
Beds
2
Baths
1,548
Sq Ft
$299/Sq Ft
Est. Value
About This Home
This home is located at 309 N Ocean Blvd, Myrtle Beach, SC 29577 and is currently estimated at $462,883, approximately $299 per square foot. 309 N Ocean Blvd is a home located in Horry County with nearby schools including Myrtle Beach Child Development Center, Myrtle Beach Primary School, and Myrtle Beach Elementary School.
Ownership History
Date
Name
Owned For
Owner Type
Purchase Details
Closed on
Jul 26, 2022
Sold by
Hoyle Stacey A
Bought by
Schwanbeck Charles J and Schwanbeck Kim
Current Estimated Value
Home Financials for this Owner
Home Financials are based on the most recent Mortgage that was taken out on this home.
Original Mortgage
$335,920
Outstanding Balance
$321,635
Interest Rate
5.7%
Mortgage Type
New Conventional
Estimated Equity
$141,248
Purchase Details
Closed on
Apr 18, 2019
Sold by
2352379 Ontario Inc
Bought by
Hoyle Stacey A and Hoyle Susan M
Home Financials for this Owner
Home Financials are based on the most recent Mortgage that was taken out on this home.
Original Mortgage
$260,000
Interest Rate
4.2%
Mortgage Type
New Conventional
Purchase Details
Closed on
Dec 18, 2014
Sold by
Kubes Joe and Kubes Leona
Bought by
2352379 Ontario Inc
Purchase Details
Closed on
Jan 15, 2002
Sold by
Martin Richard H and Martin Elizabeth J
Bought by
Kubes Joe and Kubes Leona
Create a Home Valuation Report for This Property
The Home Valuation Report is an in-depth analysis detailing your home's value as well as a comparison with similar homes in the area
Home Values in the Area
Average Home Value in this Area
Purchase History
| Date | Buyer | Sale Price | Title Company |
|---|---|---|---|
| Schwanbeck Charles J | $419,900 | -- | |
| Hoyle Stacey A | $330,000 | -- | |
| 2352379 Ontario Inc | -- | -- | |
| Kubes Joe | $211,150 | -- |
Source: Public Records
Mortgage History
| Date | Status | Borrower | Loan Amount |
|---|---|---|---|
| Open | Schwanbeck Charles J | $335,920 | |
| Previous Owner | Hoyle Stacey A | $260,000 |
Source: Public Records
Tax History Compared to Growth
Tax History
| Year | Tax Paid | Tax Assessment Tax Assessment Total Assessment is a certain percentage of the fair market value that is determined by local assessors to be the total taxable value of land and additions on the property. | Land | Improvement |
|---|---|---|---|---|
| 2024 | $7,027 | $27,600 | $0 | $27,600 |
| 2023 | $7,027 | $34,125 | $0 | $34,125 |
| 2021 | $5,074 | $34,125 | $0 | $34,125 |
| 2020 | $5,025 | $34,125 | $0 | $34,125 |
| 2019 | $3,948 | $32,550 | $0 | $32,550 |
| 2018 | $0 | $23,310 | $0 | $23,310 |
| 2017 | $3,503 | $13,320 | $0 | $13,320 |
| 2016 | -- | $13,320 | $0 | $13,320 |
| 2015 | $3,463 | $23,310 | $0 | $23,310 |
| 2014 | $3,367 | $13,320 | $0 | $13,320 |
Source: Public Records
Map
Nearby Homes
- 301 N Ocean Blvd
- 307 Flagg St Unit 105
- 307 Flagg St Unit 305
- 307 Flagg St Unit s 103 104 105 10
- 307 Flagg St Unit 103
- 311 3rd Ave N
- 308 2nd Ave N
- 504 N Ocean Blvd Unit 1803
- 504 N Ocean Blvd Unit 1502 Bay View Resort
- 504 N Ocean Blvd Unit 701
- 504 N Ocean Blvd Unit 310
- 504 N Ocean Blvd Unit 1202
- 504 N Ocean Blvd Unit 1611
- 504 N Ocean Blvd Unit 309
- 504 N Ocean Blvd Unit 210
- 504 N Ocean Blvd Unit 1011
- 504 N Ocean Blvd Unit 410
- 504 N Ocean Blvd Unit 611
- 504 N Ocean Blvd Unit 702
- 504 N Ocean Blvd Unit 602
- 309 N Ocean Blvd
- 305 N Ocean Blvd
- 305 N Ocean Blvd
- 305 N Ocean Blvd
- 305 N Ocean Blvd
- 315 N Ocean Blvd
- 315 N Ocean Blvd
- 315 N Ocean Blvd Unit 315
- 305 N Ocean Blvd Unit 305
- 305 N Ocean Blvd
- 304 N Ocean Blvd Unit 304
- 304 N Ocean Blvd
- 304 N Ocean Blvd
- 304 N Ocean Blvd
- 303 N Ocean Blvd
- 303 N Ocean Blvd
- 303 N Ocean Blvd Unit 303
- 301 N Ocean Blvd
- 301 N Ocean Blvd
- 301 N Ocean Blvd