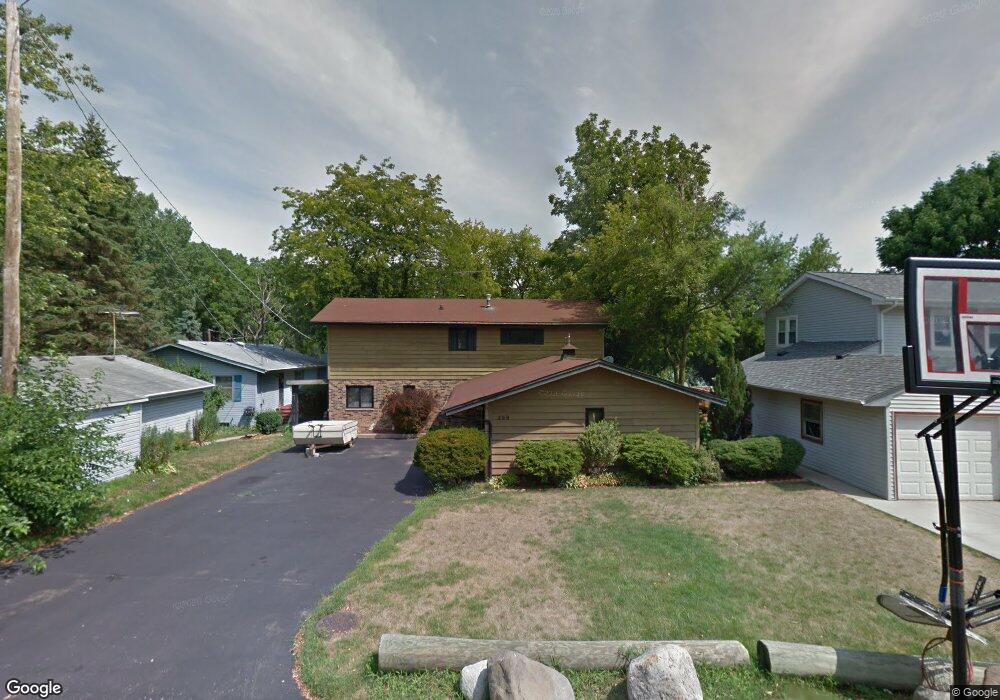
309 Pheasant Trail Lake In the Hills, IL 60156
Estimated Value: $329,383 - $379,000
3
Beds
2
Baths
2,234
Sq Ft
$158/Sq Ft
Est. Value
About This Home
This home is located at 309 Pheasant Trail, Lake In the Hills, IL 60156 and is currently estimated at $353,096, approximately $158 per square foot. 309 Pheasant Trail is a home located in McHenry County with nearby schools including Westfield Community School, Lake in the Hills Elementary School, and United Junior High School.
Ownership History
Date
Name
Owned For
Owner Type
Purchase Details
Closed on
Aug 28, 2000
Sold by
Crick Mary L
Bought by
Continental Community Bank & Trust Co and Trust #10560
Current Estimated Value
Purchase Details
Closed on
Jan 21, 1999
Sold by
First American Bank
Bought by
First American Bank and Trust #F88-155
Purchase Details
Closed on
Jul 7, 1994
Sold by
Kreider Gerald R
Bought by
Teramani Leonard and Crick Mary L
Home Financials for this Owner
Home Financials are based on the most recent Mortgage that was taken out on this home.
Original Mortgage
$155,000
Interest Rate
5.75%
Create a Home Valuation Report for This Property
The Home Valuation Report is an in-depth analysis detailing your home's value as well as a comparison with similar homes in the area
Home Values in the Area
Average Home Value in this Area
Purchase History
| Date | Buyer | Sale Price | Title Company |
|---|---|---|---|
| Continental Community Bank & Trust Co | -- | -- | |
| First American Bank | -- | Chicago Title | |
| Teramani Leonard | $171,000 | Attorneys National Title |
Source: Public Records
Mortgage History
| Date | Status | Borrower | Loan Amount |
|---|---|---|---|
| Previous Owner | Teramani Leonard | $155,000 |
Source: Public Records
Tax History Compared to Growth
Tax History
| Year | Tax Paid | Tax Assessment Tax Assessment Total Assessment is a certain percentage of the fair market value that is determined by local assessors to be the total taxable value of land and additions on the property. | Land | Improvement |
|---|---|---|---|---|
| 2024 | $7,730 | $105,606 | $24,315 | $81,291 |
| 2023 | $7,347 | $94,452 | $21,747 | $72,705 |
| 2022 | $6,087 | $75,490 | $19,627 | $55,863 |
| 2021 | $5,843 | $70,328 | $18,285 | $52,043 |
| 2020 | $5,692 | $67,839 | $17,638 | $50,201 |
| 2019 | $5,555 | $64,930 | $16,882 | $48,048 |
| 2018 | $5,510 | $62,095 | $17,013 | $45,082 |
| 2017 | $5,391 | $58,497 | $16,027 | $42,470 |
| 2016 | $5,298 | $54,865 | $15,032 | $39,833 |
| 2013 | -- | $51,182 | $14,023 | $37,159 |
Source: Public Records
Map
Nearby Homes
- Lots 10 & 11 Ramble Rd
- 135 Arquilla Dr
- 113 Pheasant Trail
- LOT 3 Blackhawk Dr
- 70 Hilltop Dr Unit 4
- 101 Oakleaf Rd
- 1019 Maple St
- 1431 Essex St
- 275 Indian Trail
- 1114 Ash St
- 16 Brian Ct
- 305 Buckingham Dr
- 909 Roger St
- 212 Village Creek Dr
- 807 Menominee Dr
- 809 Menominee Dr
- 266 Grandview Ct
- 992 Mcphee Dr
- 900 Windstone Ct
- 437 Village Creek Dr Unit 20D
- 104 Hickory Rd
- 311 Pheasant Trail
- 313 Pheasant Trail
- 106 Hickory Rd
- 315 Pheasant Trail
- 106 Lake Dr
- 108 Lake Dr
- 101 Hickory Rd
- 108 Hickory Rd
- 308 Pheasant Trail
- 110 Lake Dr
- 24 Walnut Dr
- 317 Pheasant Trail
- 306 Pheasant Trail
- 312 Pheasant Trail
- 112 Lake Dr
- 110 Hickory Rd
- 316 Pheasant Trail
- 114 Lake Dr
- 22 Walnut Dr Unit 2