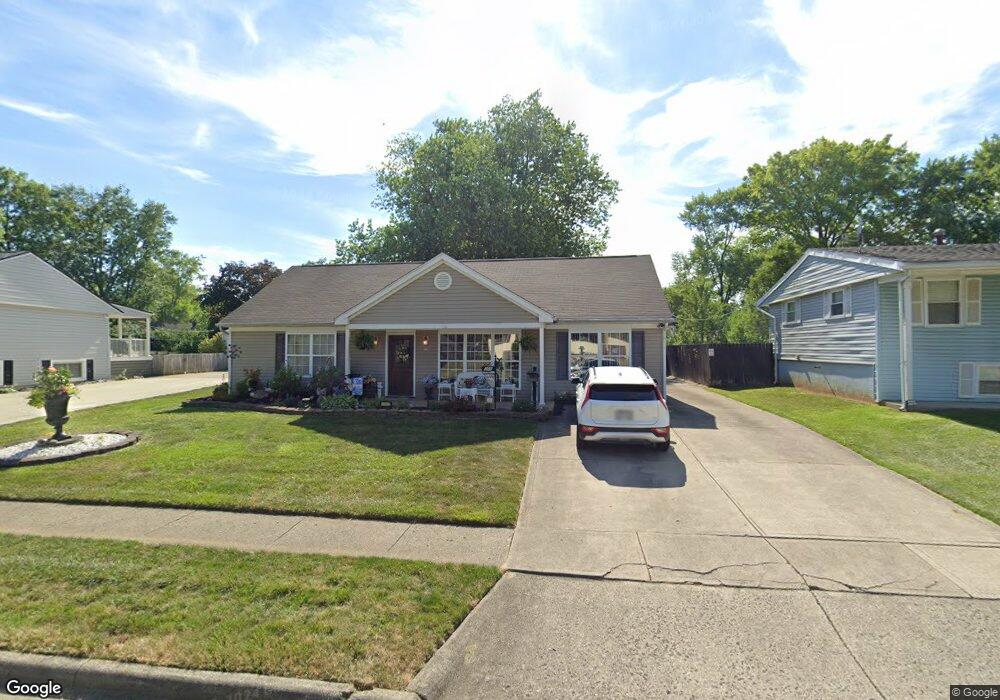
309 Regents Rd Columbus, OH 43230
Estimated Value: $297,000 - $378,000
3
Beds
2
Baths
1,956
Sq Ft
$172/Sq Ft
Est. Value
About This Home
This home is located at 309 Regents Rd, Columbus, OH 43230 and is currently estimated at $337,344, approximately $172 per square foot. 309 Regents Rd is a home located in Franklin County with nearby schools including Royal Manor Elementary School, Gahanna West Middle School, and Lincoln High School.
Ownership History
Date
Name
Owned For
Owner Type
Purchase Details
Closed on
Jan 27, 2005
Sold by
Gessner Building Corp
Bought by
Harper Ronald S and Harper Carol A
Current Estimated Value
Home Financials for this Owner
Home Financials are based on the most recent Mortgage that was taken out on this home.
Original Mortgage
$110,000
Interest Rate
5.83%
Mortgage Type
Balloon
Purchase Details
Closed on
Sep 23, 2004
Sold by
Beal Gearline J
Bought by
Gessner Building Corp
Home Financials for this Owner
Home Financials are based on the most recent Mortgage that was taken out on this home.
Original Mortgage
$108,000
Interest Rate
5.95%
Mortgage Type
Construction
Purchase Details
Closed on
Apr 17, 1963
Bought by
Beal Ronald D
Create a Home Valuation Report for This Property
The Home Valuation Report is an in-depth analysis detailing your home's value as well as a comparison with similar homes in the area
Home Values in the Area
Average Home Value in this Area
Purchase History
| Date | Buyer | Sale Price | Title Company |
|---|---|---|---|
| Harper Ronald S | $140,000 | -- | |
| Gessner Building Corp | $27,500 | -- | |
| Beal Ronald D | -- | -- |
Source: Public Records
Mortgage History
| Date | Status | Borrower | Loan Amount |
|---|---|---|---|
| Open | Harper Carol A | $107,741 | |
| Closed | Harper Carol A | $111,500 | |
| Open | Smith James C | $188,510 | |
| Previous Owner | Harper Ronald S | $110,000 | |
| Previous Owner | Gessner Building Corp | $108,000 | |
| Previous Owner | Beal Gearline J | $62,000 |
Source: Public Records
Tax History Compared to Growth
Tax History
| Year | Tax Paid | Tax Assessment Tax Assessment Total Assessment is a certain percentage of the fair market value that is determined by local assessors to be the total taxable value of land and additions on the property. | Land | Improvement |
|---|---|---|---|---|
| 2024 | $5,054 | $95,590 | $27,790 | $67,800 |
| 2023 | $5,027 | $95,585 | $27,790 | $67,795 |
| 2022 | $6,063 | $63,250 | $15,680 | $47,570 |
| 2021 | $3,936 | $63,250 | $15,680 | $47,570 |
| 2020 | $3,903 | $63,250 | $15,680 | $47,570 |
| 2019 | $3,116 | $52,160 | $13,060 | $39,100 |
| 2018 | $3,257 | $52,160 | $13,060 | $39,100 |
| 2017 | $2,860 | $52,160 | $13,060 | $39,100 |
| 2016 | $3,418 | $56,010 | $12,920 | $43,090 |
| 2015 | $3,421 | $56,010 | $12,920 | $43,090 |
| 2014 | $3,395 | $56,010 | $12,920 | $43,090 |
| 2013 | $1,686 | $56,000 | $12,915 | $43,085 |
Source: Public Records
Map
Nearby Homes
- 343 Imperial Dr
- 278 Empire Dr
- 470 Deerwood Ave E
- 404 Foxwood Dr
- 463 Lincolnshire Rd
- 221 Lincolnshire Rd
- 464 Foxwood Dr
- 668 Kenilworth Ct
- 3610 N Stygler Rd
- 600 Agler Rd
- 2741 Acarie Dr
- 4093 Adalric Dr
- 4131 Claver Dr
- 2851 Acarie Dr
- 2694 Kantian Dr
- 3888 Agler Rd
- 536 Springwood Lake Dr
- 364 Morgan Ln
- 3877 Hines Rd
- 642 Ridenour Rd