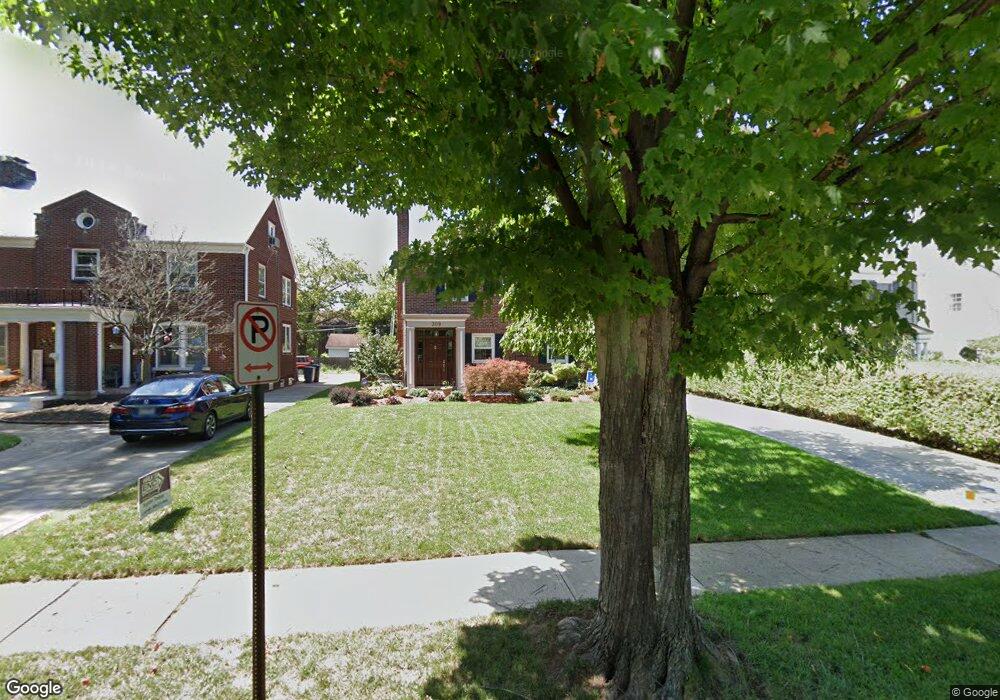
309 S Ardmore Rd Columbus, OH 43209
Estimated Value: $832,000 - $900,000
5
Beds
4
Baths
2,734
Sq Ft
$314/Sq Ft
Est. Value
About This Home
This home is located at 309 S Ardmore Rd, Columbus, OH 43209 and is currently estimated at $859,745, approximately $314 per square foot. 309 S Ardmore Rd is a home located in Franklin County with nearby schools including Cassingham Elementary School, Bexley Middle School, and Bexley High School.
Ownership History
Date
Name
Owned For
Owner Type
Purchase Details
Closed on
Apr 15, 2003
Sold by
Weiker Steven and Melfi Weiker Cynthia
Bought by
Minkin Matthew D and Minkin Rebecca C
Current Estimated Value
Home Financials for this Owner
Home Financials are based on the most recent Mortgage that was taken out on this home.
Original Mortgage
$285,000
Outstanding Balance
$122,524
Interest Rate
5.76%
Estimated Equity
$737,221
Purchase Details
Closed on
Apr 3, 2001
Sold by
Paine Scott
Bought by
Weiker Steven and Melfi Weiker Cynthia
Home Financials for this Owner
Home Financials are based on the most recent Mortgage that was taken out on this home.
Original Mortgage
$275,000
Interest Rate
7.13%
Purchase Details
Closed on
Mar 31, 2000
Sold by
Archer Susan L
Bought by
Paine Scott
Home Financials for this Owner
Home Financials are based on the most recent Mortgage that was taken out on this home.
Original Mortgage
$217,659
Interest Rate
8.29%
Mortgage Type
Purchase Money Mortgage
Purchase Details
Closed on
Aug 1, 1978
Create a Home Valuation Report for This Property
The Home Valuation Report is an in-depth analysis detailing your home's value as well as a comparison with similar homes in the area
Home Values in the Area
Average Home Value in this Area
Purchase History
| Date | Buyer | Sale Price | Title Company |
|---|---|---|---|
| Minkin Matthew D | $425,000 | Hummel Title Agency | |
| Weiker Steven | $392,500 | Hummel Title Agency Inc | |
| Paine Scott | $178,500 | Benchmark Title Agency Inc | |
| -- | $64,500 | -- |
Source: Public Records
Mortgage History
| Date | Status | Borrower | Loan Amount |
|---|---|---|---|
| Open | Minkin Matthew D | $285,000 | |
| Closed | Weiker Steven | $275,000 | |
| Closed | Paine Scott | $217,659 |
Source: Public Records
Tax History Compared to Growth
Tax History
| Year | Tax Paid | Tax Assessment Tax Assessment Total Assessment is a certain percentage of the fair market value that is determined by local assessors to be the total taxable value of land and additions on the property. | Land | Improvement |
|---|---|---|---|---|
| 2024 | $12,253 | $220,650 | $74,660 | $145,990 |
| 2023 | $11,017 | $220,640 | $74,655 | $145,985 |
| 2022 | $12,246 | $196,980 | $46,690 | $150,290 |
| 2021 | $12,256 | $196,980 | $46,690 | $150,290 |
| 2020 | $12,147 | $196,980 | $46,690 | $150,290 |
| 2019 | $11,481 | $163,800 | $38,920 | $124,880 |
| 2018 | $4,988 | $163,800 | $38,920 | $124,880 |
| 2017 | $9,862 | $163,800 | $38,920 | $124,880 |
| 2016 | $9,988 | $153,550 | $34,900 | $118,650 |
| 2015 | $5,009 | $153,550 | $34,900 | $118,650 |
| 2014 | $10,074 | $153,550 | $34,900 | $118,650 |
| 2013 | $4,760 | $139,580 | $31,710 | $107,870 |
Source: Public Records
Map
Nearby Homes
- 268 S Cassady Ave
- 2455 Dale Ave
- 208 S Stanwood Rd
- 2425 Bryden Rd
- 2424 Sherwood Rd
- 2564 Sherwood Rd
- 563 S Dawson Ave
- 2629 E Broad St
- 2717 E Broad St
- 2731 E Broad St
- 49 N Cassingham Rd
- 2738 E Broad St
- 123 S Gould Rd
- 696 Vernon Rd
- 142 S Gould Rd
- 419 Westland Ave
- 96 N Cassingham Rd
- 57 Preston Rd
- 782 S Remington Rd
- 789 Chelsea Ave
- 303 S Ardmore Rd
- 315 S Ardmore Rd
- 295 S Ardmore Rd
- 325 S Ardmore Rd
- 302 S Cassady Ave
- 296 S Cassady Ave
- 306 S Cassady Ave
- 333 S Ardmore Rd
- 290 S Cassady Ave
- 316 S Cassady Ave
- 281 S Ardmore Rd
- 312 S Ardmore Rd
- 306 S Ardmore Rd
- 320 S Ardmore Rd
- 339 S Ardmore Rd
- 324 S Cassady Ave
- 300 S Ardmore Rd
- 324 S Ardmore Rd
- 277 S Ardmore Rd
- 274 S Cassady Ave