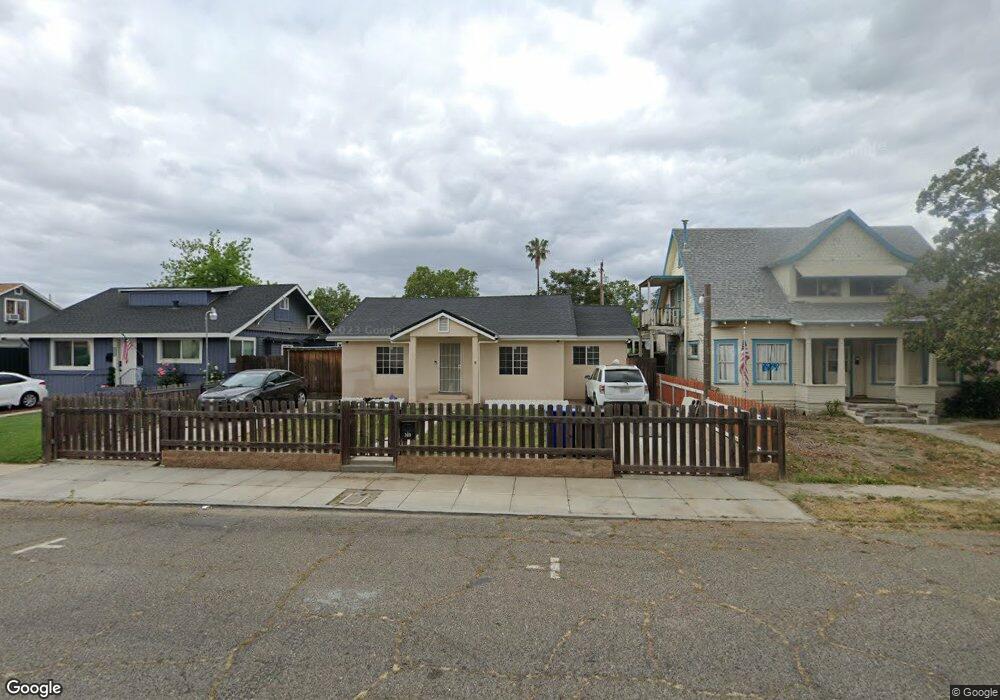
309 S Laurel St Turlock, CA 95380
Downtown Turlock NeighborhoodEstimated Value: $335,485 - $416,000
3
Beds
1
Bath
1,084
Sq Ft
$339/Sq Ft
Est. Value
About This Home
This home is located at 309 S Laurel St, Turlock, CA 95380 and is currently estimated at $367,621, approximately $339 per square foot. 309 S Laurel St is a home located in Stanislaus County with nearby schools including Wakefield Elementary School, Marvin A. Dutcher Middle School, and Turlock Junior High School.
Ownership History
Date
Name
Owned For
Owner Type
Purchase Details
Closed on
Jan 17, 2007
Sold by
Davis Roy Lee and Davis Laurel Christine
Bought by
Davis Roy Lee and Davis Laurel Christine
Current Estimated Value
Purchase Details
Closed on
Feb 4, 2005
Sold by
Davis Rodgers Diana
Bought by
Davis Roy Lee and Davis Laurel Christine
Purchase Details
Closed on
Jan 19, 1999
Sold by
Davis Powers Carla
Bought by
Davis Rodgers Diana
Purchase Details
Closed on
May 17, 1994
Sold by
Dixon Gloria Lee
Bought by
Davis Roy Lee and Davis Laurel Christine
Home Financials for this Owner
Home Financials are based on the most recent Mortgage that was taken out on this home.
Original Mortgage
$28,958
Interest Rate
8.53%
Mortgage Type
Seller Take Back
Create a Home Valuation Report for This Property
The Home Valuation Report is an in-depth analysis detailing your home's value as well as a comparison with similar homes in the area
Home Values in the Area
Average Home Value in this Area
Purchase History
| Date | Buyer | Sale Price | Title Company |
|---|---|---|---|
| Davis Roy Lee | -- | None Available | |
| Davis Roy Lee | -- | -- | |
| Davis Rodgers Diana | -- | -- | |
| Davis Roy Lee | $45,000 | Stewart Title | |
| Dixon Gloria Lee | -- | Stewart Title | |
| Dixon Gloria Lee | $25,000 | Stewart Title |
Source: Public Records
Mortgage History
| Date | Status | Borrower | Loan Amount |
|---|---|---|---|
| Previous Owner | Davis Roy Lee | $28,958 |
Source: Public Records
Tax History
| Year | Tax Paid | Tax Assessment Tax Assessment Total Assessment is a certain percentage of the fair market value that is determined by local assessors to be the total taxable value of land and additions on the property. | Land | Improvement |
|---|---|---|---|---|
| 2025 | $2,335 | $217,492 | $134,279 | $83,213 |
| 2024 | $2,292 | $213,229 | $131,647 | $81,582 |
| 2023 | $2,288 | $209,049 | $129,066 | $79,983 |
| 2022 | $2,259 | $204,951 | $126,536 | $78,415 |
| 2021 | $2,226 | $200,933 | $124,055 | $76,878 |
| 2020 | $2,211 | $198,873 | $122,783 | $76,090 |
| 2019 | $2,174 | $194,975 | $120,376 | $74,599 |
| 2018 | $2,172 | $191,153 | $118,016 | $73,137 |
| 2017 | $1,784 | $157,500 | $80,000 | $77,500 |
| 2016 | $1,548 | $143,500 | $50,000 | $93,500 |
| 2015 | $1,612 | $148,500 | $38,500 | $110,000 |
| 2014 | $1,273 | $116,000 | $30,000 | $86,000 |
Source: Public Records
Map
Nearby Homes
- 301 S Laurel St
- 315 S Laurel St
- 321 S Laurel St
- 325 S Laurel St
- 316 S Orange St
- 305 High St
- 318 S Orange St
- 320 S Orange St
- 329 S Laurel St
- 300 S Orange St
- 235 S Laurel St
- 324 S Orange St
- 327 High St
- 7 Lot 7 Berkeley Ave
- 333 S Laurel St
- 328 S Orange St
- 233 S Laurel St
- 333 High St
- 332 S Orange St
- 335 S Laurel St
Your Personal Tour Guide
Ask me questions while you tour the home.