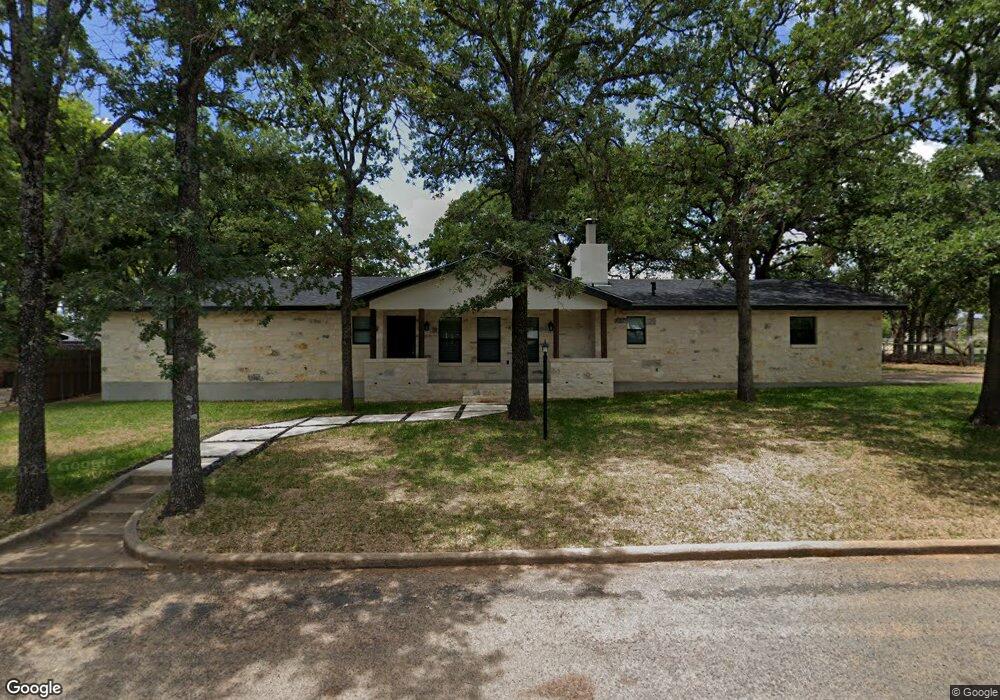
309 Tanglewood Dr Unit 2 Fredericksburg, TX 78624
Estimated Value: $721,090
--
Bed
2
Baths
1,576
Sq Ft
$458/Sq Ft
Est. Value
About This Home
This home is located at 309 Tanglewood Dr Unit 2, Fredericksburg, TX 78624 and is currently priced at $721,090, approximately $457 per square foot. 309 Tanglewood Dr Unit 2 is a home located in Gillespie County with nearby schools including Fredericksburg High School, St. Mary's Catholic School, and Ambleside School of Fredericksburg.
Ownership History
Date
Name
Owned For
Owner Type
Purchase Details
Closed on
May 6, 2022
Sold by
Allen Jenschke Craig and Lynn Stacy
Bought by
Hfpfrancis Llc
Current Estimated Value
Purchase Details
Closed on
May 5, 2021
Sold by
Granado Corina S
Bought by
Jenschke Craig Allen and Jenschke Stacy Lynn
Purchase Details
Closed on
Feb 23, 2016
Sold by
Granado Geraldine
Bought by
Granado Corina S
Purchase Details
Closed on
Feb 8, 2008
Sold by
Zellner Fred L and Zellner Doris Marei
Bought by
Rowley Chuck B and Granado Geraldine
Home Financials for this Owner
Home Financials are based on the most recent Mortgage that was taken out on this home.
Original Mortgage
$156,750
Interest Rate
6.07%
Mortgage Type
New Conventional
Create a Home Valuation Report for This Property
The Home Valuation Report is an in-depth analysis detailing your home's value as well as a comparison with similar homes in the area
Home Values in the Area
Average Home Value in this Area
Purchase History
| Date | Buyer | Sale Price | Title Company |
|---|---|---|---|
| Hfpfrancis Llc | -- | None Listed On Document | |
| Jenschke Craig Allen | -- | None Available | |
| Granado Corina S | -- | None Available | |
| Rowley Chuck B | -- | None Available |
Source: Public Records
Mortgage History
| Date | Status | Borrower | Loan Amount |
|---|---|---|---|
| Previous Owner | Rowley Chuck B | $156,750 |
Source: Public Records
Tax History Compared to Growth
Tax History
| Year | Tax Paid | Tax Assessment Tax Assessment Total Assessment is a certain percentage of the fair market value that is determined by local assessors to be the total taxable value of land and additions on the property. | Land | Improvement |
|---|---|---|---|---|
| 2025 | $10,045 | $802,400 | $178,330 | $624,070 |
| 2024 | $10,045 | $802,400 | $178,330 | $624,070 |
| 2023 | $9,830 | $802,400 | $178,330 | $624,070 |
| 2022 | $6,070 | $406,160 | $154,530 | $251,630 |
| 2021 | $5,338 | $316,450 | $86,630 | $229,820 |
| 2020 | $4,723 | $274,240 | $75,080 | $199,160 |
| 2019 | $4,900 | $274,240 | $75,080 | $199,160 |
| 2018 | $4,469 | $251,220 | $75,080 | $176,140 |
| 2017 | $4,370 | $239,020 | $75,080 | $163,940 |
| 2016 | $3,682 | $201,380 | $67,900 | $133,480 |
| 2015 | -- | $194,450 | $67,900 | $126,550 |
| 2014 | -- | $181,230 | $59,500 | $121,730 |
Source: Public Records
Map
Nearby Homes
- 307 Frederick Rd Unit 3
- 302 Frederick Rd
- 1826 Quailwood Dr
- 2023 Briarwood Cir
- 217 W Driftwood Dr
- 205 Crestwood Dr
- 202 Tanglewood Dr
- 126 Tanglewood Dr
- 126 Ridgewood Dr
- 303 Winston Dr
- 133 Stone Canyon Unit 392
- 2140 Hedgestone Unit 3
- 124 Frederick Rd
- 2009 Woodway Ct
- 2009 Woodway Ct Unit 41
- 205 Edgewood Dr
- 222 Dudley Way
- 127 Stone Canyon Unit 394
- 227 Dudley Way
- 125 Stone Canyon
- 309 Tanglewood Dr
- 307 Tanglewood Dr
- 311 Tanglewood Dr
- 310 Frederick Rd
- 314 Tanglewood Dr
- 308 Frederick Rd
- 312 Tanglewood Dr
- 305 Tanglewood Dr
- 306 Frederick Rd
- 310 Tanglewood Dr
- 2034 Briarwood Cir
- 2039 Briarwood Cir
- 307 Frederick Rd
- 303 Tanglewood Dr
- 2037 Briarwood Cir
- 404 Frederick Rd
- 402 Frederick Rd
- 313 Wildwood Dr
- 304 Frederick Rd
- 1830 Quailwood Dr