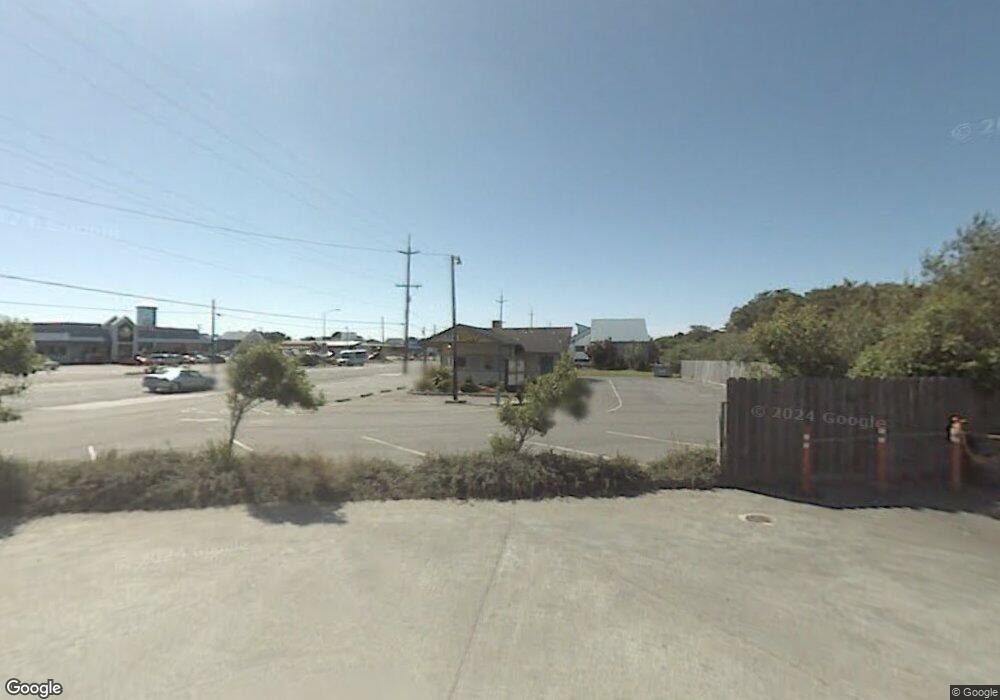
309 Us Highway 101 S Crescent City, CA 95531
--
Bed
--
Bath
941
Sq Ft
0.5
Acres
About This Home
This home is located at 309 Us Highway 101 S, Crescent City, CA 95531. 309 Us Highway 101 S is a home located in Del Norte County with nearby schools including Pine Grove Elementary School, Crescent Elk Middle School, and Del Norte High School.
Ownership History
Date
Name
Owned For
Owner Type
Purchase Details
Closed on
Sep 3, 2021
Sold by
Grossman Lindsey and Draper Family Trust
Bought by
Lre Development Llc
Home Financials for this Owner
Home Financials are based on the most recent Mortgage that was taken out on this home.
Original Mortgage
$550,000
Outstanding Balance
$500,459
Interest Rate
2.8%
Mortgage Type
Commercial
Purchase Details
Closed on
Jan 24, 2008
Sold by
Cunningham Karen S
Bought by
Draper Karen S and Draper Family Trust
Create a Home Valuation Report for This Property
The Home Valuation Report is an in-depth analysis detailing your home's value as well as a comparison with similar homes in the area
Home Values in the Area
Average Home Value in this Area
Purchase History
| Date | Buyer | Sale Price | Title Company |
|---|---|---|---|
| Lre Development Llc | $46,500 | Old Republic Title Company | |
| Draper Karen S | -- | None Available |
Source: Public Records
Mortgage History
| Date | Status | Borrower | Loan Amount |
|---|---|---|---|
| Open | Lre Development Llc | $550,000 |
Source: Public Records
Tax History Compared to Growth
Tax History
| Year | Tax Paid | Tax Assessment Tax Assessment Total Assessment is a certain percentage of the fair market value that is determined by local assessors to be the total taxable value of land and additions on the property. | Land | Improvement |
|---|---|---|---|---|
| 2025 | $2,556 | $249,383 | $212,241 | $37,142 |
| 2024 | $2,556 | $244,494 | $208,080 | $36,414 |
| 2023 | $2,502 | $239,700 | $204,000 | $35,700 |
| 2022 | $2,449 | $326,564 | $255,578 | $70,986 |
| 2021 | $3,381 | $320,162 | $250,567 | $69,595 |
| 2020 | $3,358 | $316,880 | $247,998 | $68,882 |
| 2019 | $3,303 | $310,668 | $243,136 | $67,532 |
| 2018 | $3,234 | $304,577 | $238,369 | $66,208 |
| 2017 | $3,181 | $298,606 | $233,696 | $64,910 |
| 2016 | $3,125 | $292,752 | $229,114 | $63,638 |
| 2015 | $3,053 | $288,356 | $225,673 | $62,683 |
| 2014 | $3,024 | $282,709 | $221,253 | $61,456 |
Source: Public Records
Map
Nearby Homes