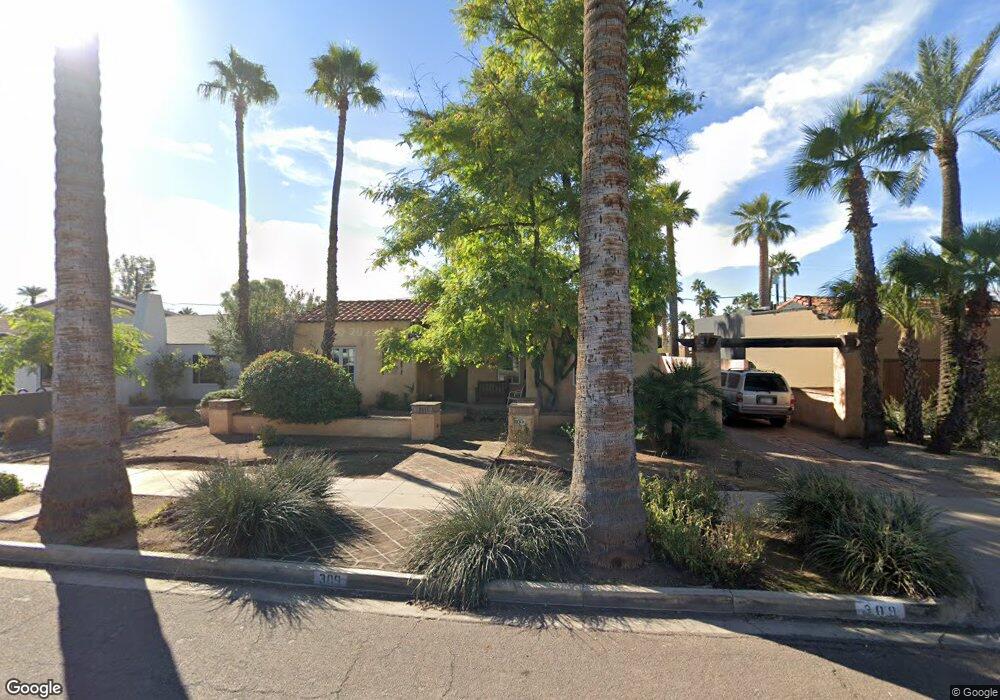
309 W Cypress St Phoenix, AZ 85003
Willo NeighborhoodEstimated Value: $807,268 - $1,080,000
Studio
2
Baths
1,950
Sq Ft
$498/Sq Ft
Est. Value
About This Home
This home is located at 309 W Cypress St, Phoenix, AZ 85003 and is currently estimated at $971,817, approximately $498 per square foot. 309 W Cypress St is a home located in Maricopa County with nearby schools including Kenilworth Elementary School, Phoenix Coding Academy, and Central High School.
Ownership History
Date
Name
Owned For
Owner Type
Purchase Details
Closed on
Jun 15, 2004
Sold by
Redard Brian J and Redard Jacqueline F
Bought by
Smith Steven E and Wurth Susan C
Current Estimated Value
Home Financials for this Owner
Home Financials are based on the most recent Mortgage that was taken out on this home.
Original Mortgage
$280,000
Interest Rate
5.25%
Mortgage Type
Purchase Money Mortgage
Purchase Details
Closed on
May 8, 1998
Sold by
Redard Jacqueline F
Bought by
Redard Brian John and Redard Jacqueline F
Home Financials for this Owner
Home Financials are based on the most recent Mortgage that was taken out on this home.
Original Mortgage
$106,000
Interest Rate
7.05%
Create a Home Valuation Report for This Property
The Home Valuation Report is an in-depth analysis detailing your home's value as well as a comparison with similar homes in the area
Home Values in the Area
Average Home Value in this Area
Purchase History
| Date | Buyer | Sale Price | Title Company |
|---|---|---|---|
| Smith Steven E | $490,000 | Capital Title Agency Inc | |
| Redard Brian John | -- | Fidelity Title |
Source: Public Records
Mortgage History
| Date | Status | Borrower | Loan Amount |
|---|---|---|---|
| Previous Owner | Smith Steven E | $280,000 | |
| Previous Owner | Redard Brian John | $106,000 |
Source: Public Records
Tax History
| Year | Tax Paid | Tax Assessment Tax Assessment Total Assessment is a certain percentage of the fair market value that is determined by local assessors to be the total taxable value of land and additions on the property. | Land | Improvement |
|---|---|---|---|---|
| 2025 | $3,557 | $25,041 | -- | -- |
| 2024 | $3,316 | $23,849 | -- | -- |
| 2023 | $3,316 | $28,980 | $5,795 | $23,185 |
| 2022 | $3,198 | $23,815 | $4,760 | $19,055 |
| 2021 | $3,174 | $22,865 | $4,570 | $18,295 |
| 2020 | $3,211 | $22,205 | $4,440 | $17,765 |
| 2019 | $3,206 | $20,730 | $4,145 | $16,585 |
| 2018 | $3,151 | $20,755 | $4,150 | $16,605 |
| 2017 | $3,078 | $20,050 | $4,010 | $16,040 |
| 2016 | $2,990 | $23,600 | $4,720 | $18,880 |
| 2015 | $2,766 | $20,085 | $4,015 | $16,070 |
Source: Public Records
Map
Nearby Homes
- 326 W Cypress St
- 301 W Holly St
- 71 W Cypress St
- 313 W Holly St
- 517 W Holly St
- 136 W Granada Rd
- 2017 N 1st Ave
- 16 W Encanto Blvd Unit 12
- 16 W Encanto Blvd Unit 22
- 16 W Encanto Blvd Unit 415
- 16 W Encanto Blvd Unit 312
- 16 W Encanto Blvd Unit 408
- 16 W Encanto Blvd Unit 26
- 16 W Encanto Blvd Unit 605
- 546 W Encanto Blvd
- 2001 N 1st Ave
- 54 W Palm Ln Unit 54
- 38 W Vernon Ave
- 34 W Vernon Ave
- 17 W Vernon Ave Unit 107
- 313 W Cypress St
- 305 W Cypress St
- 301 W Cypress St
- 317 W Cypress St
- 314 W Monte Vista Rd
- 310 W Monte Vista Rd
- 318 W Monte Vista Rd
- 306 W Cypress St
- 325 W Cypress St
- 310 W Cypress St
- 306 W Monte Vista Rd
- 314 W Cypress St
- 324 W Monte Vista Rd
- 302 W Monte Vista Rd
- 322 W Cypress St
- 102 W Cypress St
- 329 W Cypress St
- 330 W Monte Vista Rd
- 301 W Monte Vista Rd
- 309 W Monte Vista Rd
Your Personal Tour Guide
Ask me questions while you tour the home.