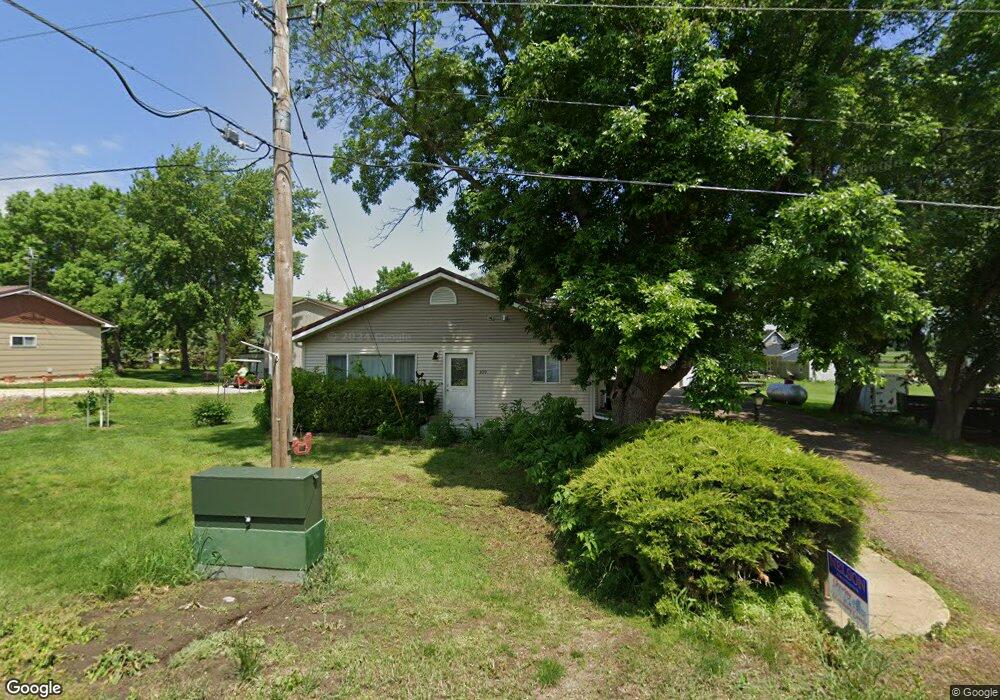
309 W Main St Anthon, IA 51004
Estimated Value: $101,000 - $216,000
3
Beds
1
Bath
1,674
Sq Ft
$87/Sq Ft
Est. Value
About This Home
This home is located at 309 W Main St, Anthon, IA 51004 and is currently estimated at $145,989, approximately $87 per square foot. 309 W Main St is a home located in Woodbury County with nearby schools including Anthon Elementary School, Mvao Middle School, and Maple Valley-Anthon Oto High School.
Ownership History
Date
Name
Owned For
Owner Type
Purchase Details
Closed on
Aug 23, 2018
Sold by
Kindig Ladonna K
Bought by
Westphal Connie L
Current Estimated Value
Home Financials for this Owner
Home Financials are based on the most recent Mortgage that was taken out on this home.
Original Mortgage
$65,000
Outstanding Balance
$48,271
Interest Rate
4.5%
Mortgage Type
FHA
Estimated Equity
$97,718
Create a Home Valuation Report for This Property
The Home Valuation Report is an in-depth analysis detailing your home's value as well as a comparison with similar homes in the area
Purchase History
| Date | Buyer | Sale Price | Title Company |
|---|---|---|---|
| Westphal Connie L | $32,500 | -- |
Source: Public Records
Mortgage History
| Date | Status | Borrower | Loan Amount |
|---|---|---|---|
| Open | Westphal Connie L | $65,000 |
Source: Public Records
Tax History
| Year | Tax Paid | Tax Assessment Tax Assessment Total Assessment is a certain percentage of the fair market value that is determined by local assessors to be the total taxable value of land and additions on the property. | Land | Improvement |
|---|---|---|---|---|
| 2025 | $1,434 | $108,740 | $8,080 | $100,660 |
| 2024 | $14 | $96,140 | $8,080 | $88,060 |
| 2023 | $1,312 | $96,140 | $8,080 | $88,060 |
| 2022 | $1,282 | $77,510 | $8,080 | $69,430 |
| 2021 | $1,282 | $77,510 | $8,080 | $69,430 |
| 2020 | $1,408 | $82,810 | $8,650 | $74,160 |
| 2019 | $1,306 | $81,340 | $8,650 | $72,690 |
| 2018 | $1,290 | $81,340 | $8,650 | $72,690 |
| 2017 | $1,312 | $81,340 | $8,650 | $72,690 |
| 2016 | $1,278 | $81,340 | $0 | $0 |
| 2015 | $1,266 | $76,010 | $8,080 | $67,930 |
| 2014 | $1,249 | $71,160 | $8,080 | $63,080 |
Source: Public Records
Map
Nearby Homes
- 309 W Main St
- 405 W Main St
- 400 W Bridge St
- 300 W Bridge St
- 300 W Bridge St
- 306 W Main St
- 207 W Main St
- 409 W Main St
- 300 W Main St
- 408 W Bridge St
- 400 W Main St
- 208 W Main St
- 305 W Randolph St
- 200 W Bridge St
- 307 W Randolph St
- 206 W Main St
- 301 W Randolph St
- 500 W Bridge St
- 501 W Main St
- 204 W Main St
Your Personal Tour Guide
Ask me questions while you tour the home.