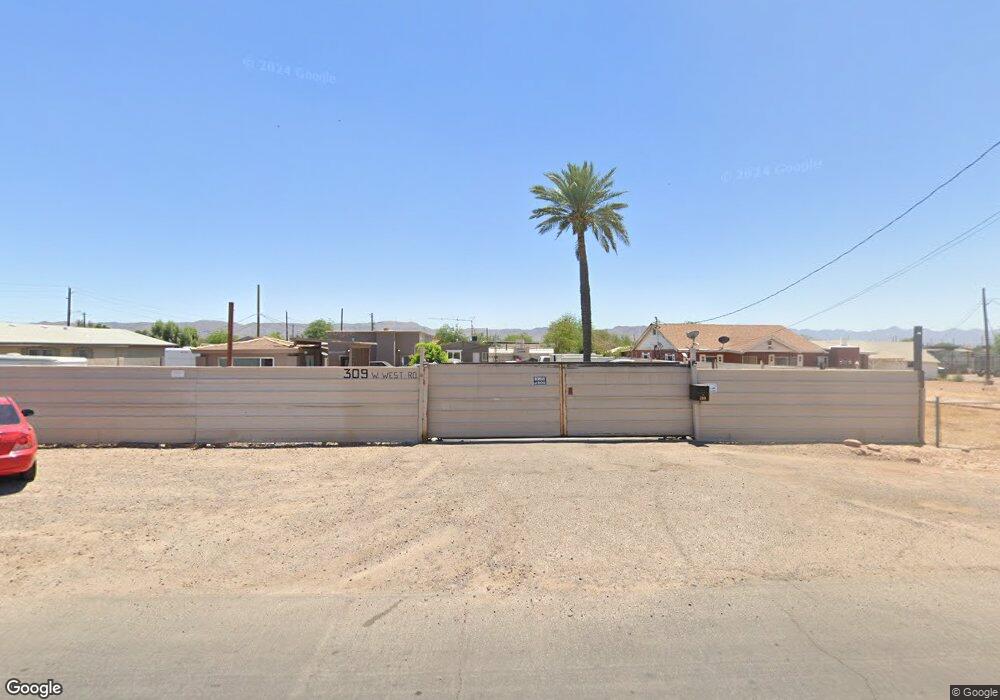
309 W West Rd Phoenix, AZ 85041
South Mountain NeighborhoodEstimated Value: $240,000 - $281,000
--
Bed
1
Bath
1,018
Sq Ft
$257/Sq Ft
Est. Value
About This Home
This home is located at 309 W West Rd, Phoenix, AZ 85041 and is currently estimated at $261,606, approximately $256 per square foot. 309 W West Rd is a home located in Maricopa County with nearby schools including Cesar E Chavez Community School, Cesar Chavez High School, and Phoenix Coding Academy.
Ownership History
Date
Name
Owned For
Owner Type
Purchase Details
Closed on
Oct 30, 2023
Sold by
Suarez Diana C
Bought by
Suarez Renato and Castro Ana Laura
Current Estimated Value
Purchase Details
Closed on
Jun 3, 2011
Sold by
Casa Calasa Llc
Bought by
Viveros Victor Aguilar
Home Financials for this Owner
Home Financials are based on the most recent Mortgage that was taken out on this home.
Original Mortgage
$58,419
Interest Rate
4.71%
Mortgage Type
Seller Take Back
Purchase Details
Closed on
Oct 5, 2010
Sold by
Gutierrez Jose and Gutierrez Maria
Bought by
Casa Calasa Llc
Purchase Details
Closed on
Jul 28, 2000
Sold by
Serna Eddie M
Bought by
Gutierrez Jose and Gutierrez Maria
Home Financials for this Owner
Home Financials are based on the most recent Mortgage that was taken out on this home.
Original Mortgage
$69,440
Interest Rate
10.39%
Mortgage Type
New Conventional
Create a Home Valuation Report for This Property
The Home Valuation Report is an in-depth analysis detailing your home's value as well as a comparison with similar homes in the area
Home Values in the Area
Average Home Value in this Area
Purchase History
| Date | Buyer | Sale Price | Title Company |
|---|---|---|---|
| Suarez Renato | -- | None Listed On Document | |
| Viveros Victor Aguilar | $69,000 | Security Title Agency | |
| Casa Calasa Llc | $28,400 | None Available | |
| Gutierrez Jose | $87,000 | Capital Title Agency |
Source: Public Records
Mortgage History
| Date | Status | Borrower | Loan Amount |
|---|---|---|---|
| Previous Owner | Viveros Victor Aguilar | $58,419 | |
| Previous Owner | Gutierrez Jose | $69,440 |
Source: Public Records
Tax History Compared to Growth
Tax History
| Year | Tax Paid | Tax Assessment Tax Assessment Total Assessment is a certain percentage of the fair market value that is determined by local assessors to be the total taxable value of land and additions on the property. | Land | Improvement |
|---|---|---|---|---|
| 2025 | $1,492 | $10,161 | -- | -- |
| 2024 | $1,450 | $9,677 | -- | -- |
| 2023 | $1,450 | $17,950 | $3,590 | $14,360 |
| 2022 | $1,421 | $13,100 | $2,620 | $10,480 |
| 2021 | $510 | $10,470 | $2,090 | $8,380 |
| 2020 | $504 | $8,720 | $1,740 | $6,980 |
| 2019 | $487 | $7,020 | $1,400 | $5,620 |
| 2018 | $474 | $6,020 | $1,200 | $4,820 |
| 2017 | $398 | $4,530 | $900 | $3,630 |
| 2016 | $378 | $3,900 | $780 | $3,120 |
| 2015 | $351 | $3,150 | $630 | $2,520 |
Source: Public Records
Map
Nearby Homes
- 313 W Jones Ave
- 112 W West Rd
- 25 W Illini St
- 126 W Pueblo Ave
- 11 W Illini St
- 3418 S Central Ave
- 4202 S 3rd St Unit 5
- 250 W Wier Ave
- 643 W Wier Ave
- 920 W Tamarisk St
- 945 W Corona Ave
- 515 W Romley Ave
- 4604 S 5th St
- 502 E Roeser Rd
- 4441 S 8th St
- 5011 S 6th Way
- 5023 S 6th Way
- 8503 S 9th Dr Unit 17
- 5519 S 11th Ave
- 1548 W Roeser Rd
- 4114 S 3rd Ave
- 4114 S 3rd Ave Unit unk
- 4114 S 3rd Ave
- 4114 S 3rd Ave
- 4114 S 3rd Ave
- 4114 S 3rd Ave
- 4114 S 3rd Ave
- 4114 S 3rd Ave
- 4114 S 3rd Ave
- 4114 S 3rd Ave
- 313 W West Rd
- 317 W West Rd
- 3920 S 3rd Ave
- 3926 S 3rd Ave
- 141 W Illini St
- 321 W West Rd
- 3928 S 3rd Ave
- 3919 S 3rd Ave
- 137 W Illini St
- 142 W Illini St