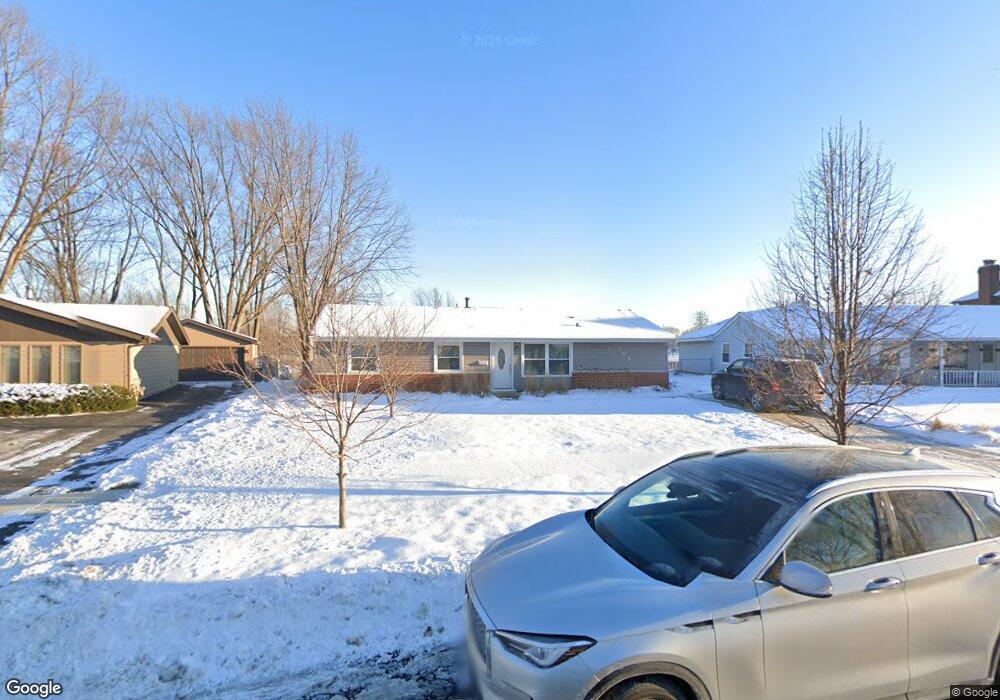
309 Wakefield Ln Schaumburg, IL 60193
South Schaumburg NeighborhoodEstimated Value: $346,000 - $413,000
3
Beds
1
Bath
1,274
Sq Ft
$302/Sq Ft
Est. Value
About This Home
This home is located at 309 Wakefield Ln, Schaumburg, IL 60193 and is currently estimated at $384,489, approximately $301 per square foot. 309 Wakefield Ln is a home located in Cook County with nearby schools including Thomas Dooley Elementary School, Jane Addams Junior High School, and Schaumburg High School.
Ownership History
Date
Name
Owned For
Owner Type
Purchase Details
Closed on
Mar 21, 2013
Sold by
Right Residential Series 4 Llc
Bought by
Williams Dawn
Current Estimated Value
Home Financials for this Owner
Home Financials are based on the most recent Mortgage that was taken out on this home.
Original Mortgage
$159,200
Outstanding Balance
$112,139
Interest Rate
3.5%
Mortgage Type
New Conventional
Estimated Equity
$272,350
Purchase Details
Closed on
Dec 6, 2012
Sold by
Niksch Robert
Bought by
Right Residential Series 4 Llc
Purchase Details
Closed on
Jun 27, 1997
Sold by
Bednarke Scott T and Bednarke Karen A
Bought by
Niksch Robert and Niksch Kathleen
Home Financials for this Owner
Home Financials are based on the most recent Mortgage that was taken out on this home.
Original Mortgage
$149,600
Interest Rate
7.68%
Create a Home Valuation Report for This Property
The Home Valuation Report is an in-depth analysis detailing your home's value as well as a comparison with similar homes in the area
Home Values in the Area
Average Home Value in this Area
Purchase History
| Date | Buyer | Sale Price | Title Company |
|---|---|---|---|
| Williams Dawn | $199,000 | None Available | |
| Right Residential Series 4 Llc | $108,500 | None Available | |
| Niksch Robert | $157,500 | -- |
Source: Public Records
Mortgage History
| Date | Status | Borrower | Loan Amount |
|---|---|---|---|
| Open | Williams Dawn | $159,200 | |
| Previous Owner | Niksch Robert | $149,600 |
Source: Public Records
Tax History Compared to Growth
Tax History
| Year | Tax Paid | Tax Assessment Tax Assessment Total Assessment is a certain percentage of the fair market value that is determined by local assessors to be the total taxable value of land and additions on the property. | Land | Improvement |
|---|---|---|---|---|
| 2024 | $6,907 | $27,973 | $13,973 | $14,000 |
| 2023 | $6,670 | $27,973 | $13,973 | $14,000 |
| 2022 | $6,670 | $27,973 | $13,973 | $14,000 |
| 2021 | $6,222 | $23,860 | $12,912 | $10,948 |
| 2020 | $6,183 | $23,860 | $12,912 | $10,948 |
| 2019 | $6,267 | $26,810 | $12,912 | $13,898 |
| 2018 | $6,040 | $23,561 | $11,553 | $12,008 |
| 2017 | $5,962 | $23,561 | $11,553 | $12,008 |
| 2016 | $5,818 | $23,561 | $11,553 | $12,008 |
| 2015 | $5,412 | $20,712 | $10,194 | $10,518 |
| 2014 | $5,368 | $20,712 | $10,194 | $10,518 |
| 2013 | $5,971 | $20,712 | $10,194 | $10,518 |
Source: Public Records
Map
Nearby Homes
- 305 Williams Dr
- 908 Jeffery Ct
- 1125 Charlene Ln
- 1321 Yarmouth Ct Unit 662
- 220 Kemah Ln
- 1027 Duxbury Ln
- 104 N Braintree Dr
- 507 Ash Ct
- 521 Auburn Ln
- 1403 Hampton Ln
- 818 Brentwood Ct
- 519 S Springinsguth Rd
- 100 Ellington Dr
- 1614 Kingston Ln
- 412 Redwood Ln
- 831 Pinehurst Ln
- 124 Westover Ln
- 100 Westover Ln
- 988 Chelsea Ln
- 702 Auburn Cir
- 311 Wakefield Ln
- 307 Wakefield Ln
- 313 Wakefield Ln
- 303 Wakefield Ln
- 302 Wakefield Ln
- 304 Wakefield Ln
- 301 Wakefield Ln
- 300 Wakefield Ln
- 315 Wakefield Ln
- 306 Wakefield Ln
- 237 Wakefield Ln
- 317 Wakefield Ln
- 224 Wakefield Ln
- 234 Wakefield Ln
- 308 Wakefield Ln
- 235 Wakefield Ln
- 319 Wakefield Ln
- 218 Wakefield Ln
- 212 Wakefield Ln
- 310 Wakefield Ln Unit 3