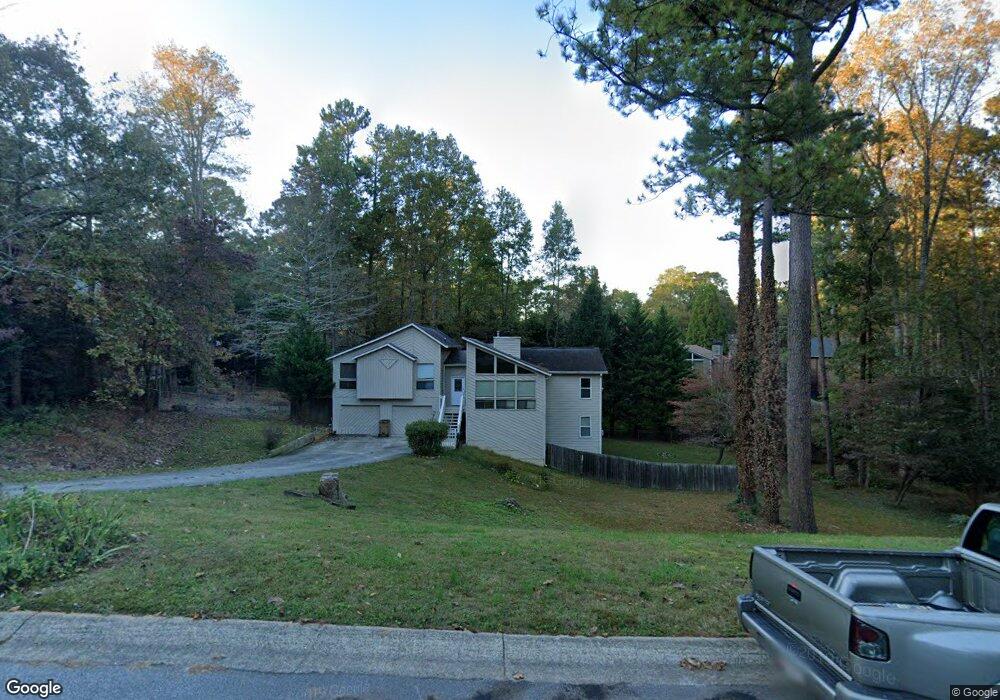
309 Walking Horse Way NE Unit 3 Kennesaw, GA 30144
Sandy Plains NeighborhoodEstimated Value: $317,000 - $397,000
3
Beds
2
Baths
1,798
Sq Ft
$201/Sq Ft
Est. Value
About This Home
This home is located at 309 Walking Horse Way NE Unit 3, Kennesaw, GA 30144 and is currently estimated at $361,375, approximately $200 per square foot. 309 Walking Horse Way NE Unit 3 is a home located in Cobb County with nearby schools including Blackwell Elementary School, McCleskey Middle School, and Kell High School.
Ownership History
Date
Name
Owned For
Owner Type
Purchase Details
Closed on
Dec 18, 2020
Sold by
Collins Phillip G
Bought by
Chorba Sabryn Bennet and Chorba Tierah
Current Estimated Value
Home Financials for this Owner
Home Financials are based on the most recent Mortgage that was taken out on this home.
Original Mortgage
$211,105
Outstanding Balance
$188,282
Interest Rate
2.8%
Mortgage Type
FHA
Estimated Equity
$173,093
Purchase Details
Closed on
Nov 17, 2015
Sold by
Collins Christine
Bought by
Collins Phillip G
Purchase Details
Closed on
Jun 28, 2001
Sold by
Moran Pamela S
Bought by
Collins Phillip G and Collins Christine
Home Financials for this Owner
Home Financials are based on the most recent Mortgage that was taken out on this home.
Original Mortgage
$114,000
Interest Rate
7.09%
Mortgage Type
New Conventional
Purchase Details
Closed on
Aug 29, 1994
Sold by
Waldron William N Julie A
Bought by
Moran Pamela S
Create a Home Valuation Report for This Property
The Home Valuation Report is an in-depth analysis detailing your home's value as well as a comparison with similar homes in the area
Home Values in the Area
Average Home Value in this Area
Purchase History
| Date | Buyer | Sale Price | Title Company |
|---|---|---|---|
| Chorba Sabryn Bennet | $215,000 | None Available | |
| Collins Phillip G | -- | -- | |
| Collins Phillip G | $142,500 | -- | |
| Moran Pamela S | $104,100 | -- |
Source: Public Records
Mortgage History
| Date | Status | Borrower | Loan Amount |
|---|---|---|---|
| Open | Chorba Sabryn Bennet | $211,105 | |
| Previous Owner | Collins Phillip G | $114,000 | |
| Closed | Moran Pamela S | -- |
Source: Public Records
Tax History Compared to Growth
Tax History
| Year | Tax Paid | Tax Assessment Tax Assessment Total Assessment is a certain percentage of the fair market value that is determined by local assessors to be the total taxable value of land and additions on the property. | Land | Improvement |
|---|---|---|---|---|
| 2024 | $3,713 | $123,160 | $28,000 | $95,160 |
| 2023 | $3,713 | $123,160 | $28,000 | $95,160 |
| 2022 | $3,205 | $105,604 | $22,000 | $83,604 |
| 2021 | $2,557 | $84,260 | $14,000 | $70,260 |
| 2020 | $1,957 | $84,260 | $14,000 | $70,260 |
| 2019 | $1,686 | $71,916 | $14,000 | $57,916 |
| 2018 | $1,686 | $71,916 | $14,000 | $57,916 |
| 2017 | $1,449 | $63,532 | $14,000 | $49,532 |
| 2016 | $1,451 | $63,532 | $14,000 | $49,532 |
| 2015 | $964 | $41,560 | $14,000 | $27,560 |
| 2014 | $972 | $41,560 | $0 | $0 |
Source: Public Records
Map
Nearby Homes
- 597 Farmbrook Trail NE
- 0 Watkins Glen Dr NE Unit 10506865
- 0 Watkins Glen Dr NE Unit 7564156
- 529 Hawkins Store Rd NE
- 0 Lake Latimer Dr NE Unit 10506857
- 44 Lake Latimer Dr NE
- 46 Lake Latimer Dr NE
- 48 Lake Latimer Dr NE
- 0 Lake Latimer Dr NE Unit 7564947
- 4704 Lincoln Dr NE
- 559 Farmbrook Trail NE
- The Gavin E Plan at The Village at Shallowford - Signature Series
- The Marion A Plan at The Village at Shallowford - Classic Series
- The Cary A Plan at The Village at Shallowford - Classic Series
- 163 Castleair Ct NE
- 4669 Blue Topaz Trail
- 570 Charing Cross Dr
- 750 Alison Jane Ct NE
- 639 Tigers Eye Terrace
- 4560 Kings Crossing Dr NE Unit 3
- 311 Walking Horse Way NE
- 314 Sway Branch Ln NE
- 4562 Kings Crossing Dr NE
- 316 Sway Branch Ln NE
- 312 Sway Branch Ln NE
- 0 Hoofbeat Trail NE Unit 8696741
- 0 Hoofbeat Trail NE Unit 8608735
- 0 Hoofbeat Trail NE Unit 8525551
- 0 Hoofbeat Trail NE Unit 8781319
- 0 Hoofbeat Trail NE Unit 8933740
- 0 Hoofbeat Trail NE Unit 7168712
- 0 Hoofbeat Trail NE Unit 7476446
- 0 Hoofbeat Trail NE Unit 7544444
- 0 Hoofbeat Trail NE Unit 7543756
- 0 Hoofbeat Trail NE Unit 8017882
- 0 Hoofbeat Trail NE Unit 8017918
- 310 Walking Horse Way NE
- 4564 Kings Crossing Dr NE
- 306 Walking Horse Way NE Unit 3