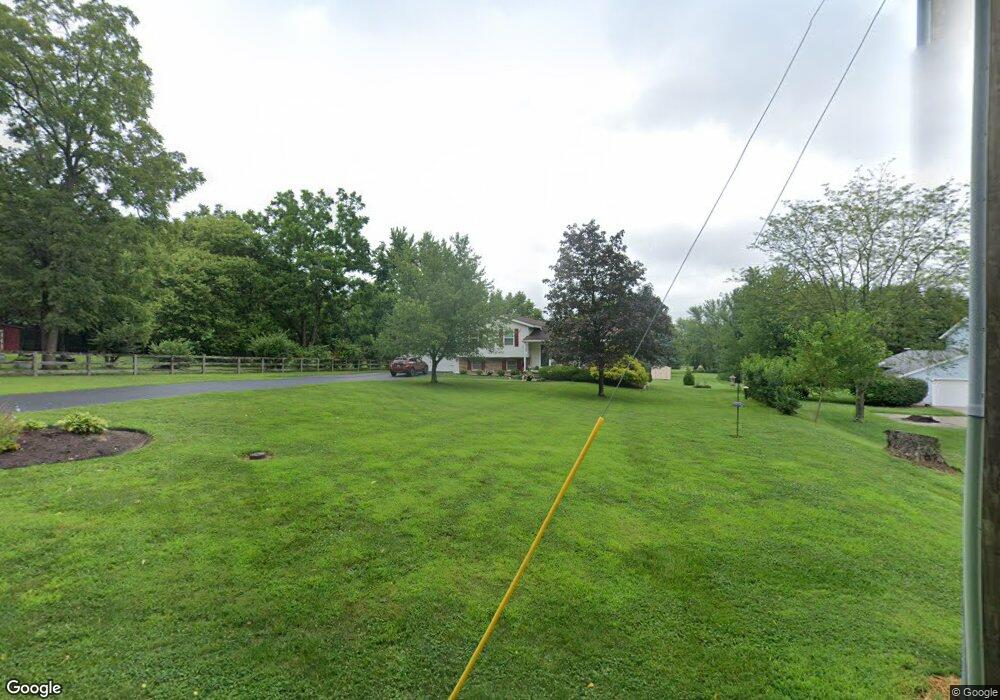
3090 Pekin Rd Springboro, OH 45066
Estimated Value: $327,603 - $375,000
3
Beds
2
Baths
1,352
Sq Ft
$266/Sq Ft
Est. Value
About This Home
This home is located at 3090 Pekin Rd, Springboro, OH 45066 and is currently estimated at $359,901, approximately $266 per square foot. 3090 Pekin Rd is a home located in Warren County with nearby schools including Clearcreek Elementary School, Dennis Elementary School, and Springboro Intermediate School.
Ownership History
Date
Name
Owned For
Owner Type
Purchase Details
Closed on
May 30, 2003
Sold by
Macy Edward D
Bought by
Dolan Michael R and Dolan Amy T
Current Estimated Value
Home Financials for this Owner
Home Financials are based on the most recent Mortgage that was taken out on this home.
Original Mortgage
$131,200
Outstanding Balance
$55,400
Interest Rate
5.88%
Mortgage Type
Purchase Money Mortgage
Estimated Equity
$304,501
Purchase Details
Closed on
May 20, 1991
Sold by
Roe Roe and Roe Willard
Bought by
Roe Roe and Roe Willard
Create a Home Valuation Report for This Property
The Home Valuation Report is an in-depth analysis detailing your home's value as well as a comparison with similar homes in the area
Home Values in the Area
Average Home Value in this Area
Purchase History
| Date | Buyer | Sale Price | Title Company |
|---|---|---|---|
| Dolan Michael R | $164,000 | Home Services Title Llc | |
| Roe Roe | -- | -- |
Source: Public Records
Mortgage History
| Date | Status | Borrower | Loan Amount |
|---|---|---|---|
| Open | Dolan Michael R | $131,200 |
Source: Public Records
Tax History
| Year | Tax Paid | Tax Assessment Tax Assessment Total Assessment is a certain percentage of the fair market value that is determined by local assessors to be the total taxable value of land and additions on the property. | Land | Improvement |
|---|---|---|---|---|
| 2025 | $3,235 | $89,290 | $23,370 | $65,920 |
| 2024 | $3,235 | $89,290 | $23,370 | $65,920 |
| 2023 | $2,804 | $71,501 | $13,097 | $58,404 |
| 2022 | $2,753 | $71,502 | $13,097 | $58,405 |
| 2021 | $2,544 | $71,502 | $13,097 | $58,405 |
| 2020 | $2,364 | $58,132 | $10,647 | $47,485 |
| 2019 | $2,377 | $58,132 | $10,647 | $47,485 |
| 2018 | $2,377 | $58,132 | $10,647 | $47,485 |
| 2017 | $2,381 | $52,451 | $9,755 | $42,697 |
| 2016 | $2,484 | $52,451 | $9,755 | $42,697 |
| 2015 | $2,489 | $52,451 | $9,755 | $42,697 |
| 2014 | $2,353 | $47,260 | $8,800 | $38,470 |
| 2013 | $2,351 | $57,160 | $10,620 | $46,540 |
Source: Public Records
Map
Nearby Homes
- 3385 Madison Grace Way
- 3457 Madison Grace Way
- 2442 Berkeley Ct
- 2276 Presley Ct
- Lot 22 Legendary Way
- 3626 Colton Ct
- 5265 Robinson Vail Rd
- 5291 Weidner Rd
- 3386 Old State Route 123
- 3574 Mclean Rd
- 3644 Connie Dr
- 3545 Robinson Vail Rd
- 3095 Canvasback Ct
- 3071 Canvasback Ct
- 3077 Canvasback Ct
- 3089 Canvasback Ct
- 3083 Canvasback Ct
- 3098 Canvasback Ct
- 3086 Canvasback Ct
- 3074 Canvasback Ct
- 3076 Pekin Rd
- 3076 W Pekin Rd
- 3112 Pekin Rd
- 3112 W Pekin Rd
- 3097 Pekin Rd
- 3065 Pekin Rd
- 3024 Pekin Rd
- 3107 Honeytree Ln
- 3024 W Pekin Rd
- 3136 Pekin Rd
- 3075 Honeytree Ln
- 3133 Honeytree Ln
- 3019 Pekin Rd
- 3025 Honeytree Ln
- 3147 Pekin Rd
- 3001 Pekin Rd
- 3158 Pekin Rd
- 2987 Pekin Rd
- 2973 Pekin Rd
- Lot Honeytree Ln
Your Personal Tour Guide
Ask me questions while you tour the home.