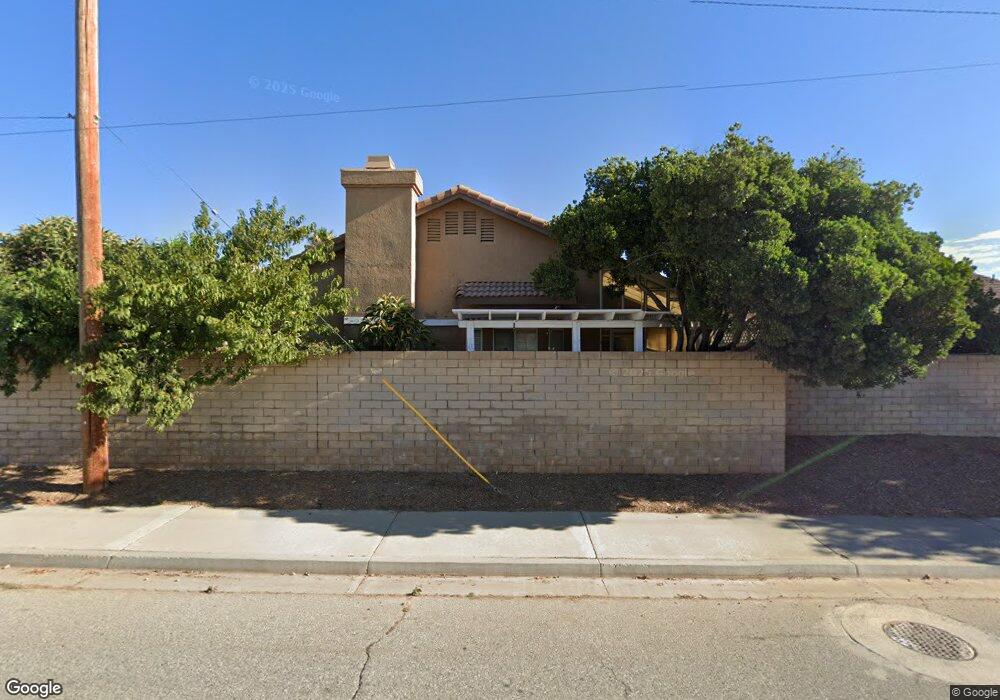
3090 Rainbow Ln Banning, CA 92220
Estimated Value: $375,000 - $420,000
3
Beds
3
Baths
1,882
Sq Ft
$210/Sq Ft
Est. Value
About This Home
This home is located at 3090 Rainbow Ln, Banning, CA 92220 and is currently estimated at $394,834, approximately $209 per square foot. 3090 Rainbow Ln is a home located in Riverside County with nearby schools including Banning High School, Calvary Christian School, and Pass Christian School.
Ownership History
Date
Name
Owned For
Owner Type
Purchase Details
Closed on
Mar 25, 2024
Sold by
Robert J Coughlin Revocable Living Trust
Bought by
Coughlin Brendan J
Current Estimated Value
Purchase Details
Closed on
Feb 8, 2021
Sold by
Coughlin Robert J
Bought by
Coughlin Robert J and Robert J Coughlin Revocable Li
Purchase Details
Closed on
Jun 28, 1995
Sold by
Sirco Development Inc
Bought by
Coughlin Robert J and Coughlin Eleanor C
Home Financials for this Owner
Home Financials are based on the most recent Mortgage that was taken out on this home.
Original Mortgage
$116,350
Interest Rate
7.88%
Purchase Details
Closed on
Nov 7, 1994
Sold by
Ba Properties Inc
Bought by
Sirco Development Inc
Purchase Details
Closed on
Oct 27, 1993
Sold by
Equitable Deed Company
Bought by
Ba Properties Inc
Create a Home Valuation Report for This Property
The Home Valuation Report is an in-depth analysis detailing your home's value as well as a comparison with similar homes in the area
Home Values in the Area
Average Home Value in this Area
Purchase History
| Date | Buyer | Sale Price | Title Company |
|---|---|---|---|
| Coughlin Brendan J | -- | None Listed On Document | |
| Coughlin Robert J | -- | None Available | |
| Coughlin Robert J | $122,500 | Chicago Title Co | |
| Sirco Development Inc | -- | Chicago Title Co | |
| Ba Properties Inc | $404,191 | Chicago Title Company |
Source: Public Records
Mortgage History
| Date | Status | Borrower | Loan Amount |
|---|---|---|---|
| Previous Owner | Coughlin Robert J | $116,350 |
Source: Public Records
Tax History Compared to Growth
Tax History
| Year | Tax Paid | Tax Assessment Tax Assessment Total Assessment is a certain percentage of the fair market value that is determined by local assessors to be the total taxable value of land and additions on the property. | Land | Improvement |
|---|---|---|---|---|
| 2025 | $5,312 | $390,150 | $20,808 | $369,342 |
| 2023 | $5,312 | $72,239 | $22,549 | $49,690 |
| 2022 | $954 | $70,823 | $22,107 | $48,716 |
| 2021 | $935 | $69,435 | $21,674 | $47,761 |
| 2020 | $924 | $68,721 | $21,451 | $47,270 |
| 2019 | $908 | $67,375 | $21,031 | $46,344 |
| 2018 | $899 | $66,055 | $20,620 | $45,435 |
| 2017 | $882 | $64,761 | $20,216 | $44,545 |
| 2016 | $838 | $63,492 | $19,820 | $43,672 |
| 2015 | $824 | $62,540 | $19,523 | $43,017 |
| 2014 | $817 | $61,317 | $19,142 | $42,175 |
Source: Public Records
Map
Nearby Homes
- 3060 Summer Set Cir
- 2906 Summer Set Cir
- 738 Amber Sky St
- 2664 Hazy Way
- 555 S 22nd St
- 42850 Hill Top Dr
- 612 S 22nd St
- 2174 W Monroe St
- 43145 Bob Cat Rd
- 3694 W Ramsey St
- 2356 W Hays St
- 3800 W Jacinto View Rd
- 2288 W Williams St
- 3880 W Jacinto View Rd Unit D
- 3880 W Jacinto View Rd Unit M
- 3066 W George St
- 3800 W Wilson St Unit 26
- 3800 W Wilson St Unit 295
- 3800 W Wilson St Unit 394
- 3800 W Wilson St Unit 256
- 3108 Rainbow Ln
- 3078 Rainbow Ln
- 3062 Rainbow Ln
- 3124 Rainbow Ln
- 3091 Rainbow Ln
- 3107 Rainbow Ln
- 761 Stormie Way
- 3046 Rainbow Ln
- 3123 Rainbow Ln
- 3146 Rainbow Ln
- 743 Stormie Way
- 3030 Rainbow Ln
- 783 Sunshine St
- 729 Stormie Way
- 760 Stormie Way
- 757 Sunshine St
- 3016 Rainbow Ln
- 744 Stormie Way
- 728 Stormie Way
- 3002 Rainbow Ln