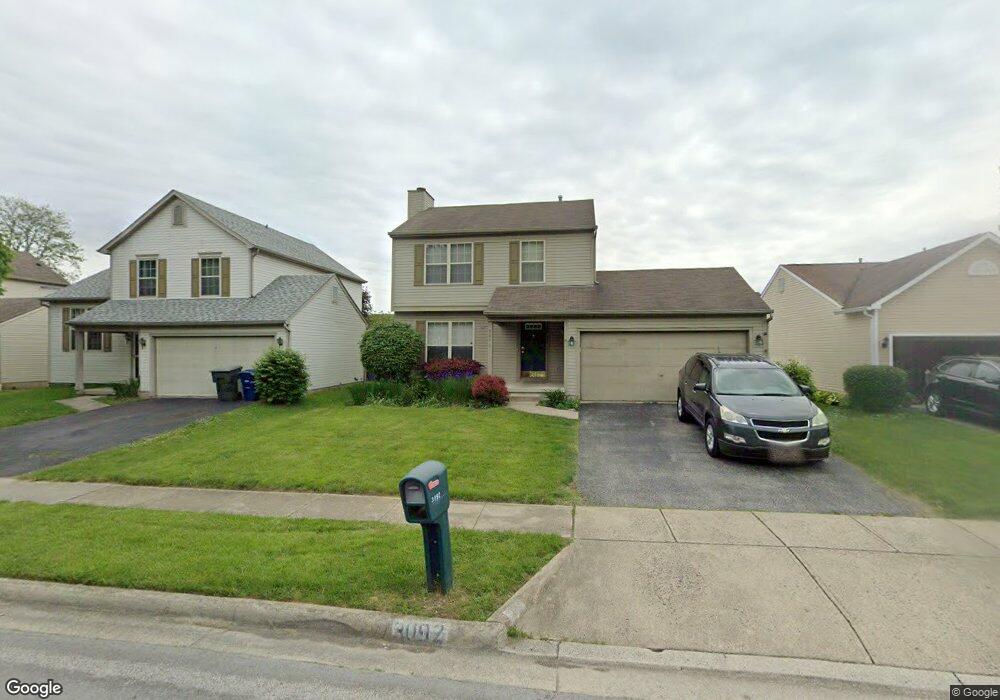
3092 Stonebluff Dr Columbus, OH 43232
Glenbrook NeighborhoodEstimated Value: $239,000 - $273,000
3
Beds
3
Baths
1,391
Sq Ft
$186/Sq Ft
Est. Value
About This Home
This home is located at 3092 Stonebluff Dr, Columbus, OH 43232 and is currently estimated at $258,730, approximately $186 per square foot. 3092 Stonebluff Dr is a home located in Franklin County with nearby schools including Groveport Madison High School, Millennium Community School, and Eastland Preparatory Academy.
Ownership History
Date
Name
Owned For
Owner Type
Purchase Details
Closed on
Jun 30, 2020
Sold by
Rasor Jason J and Rasor Jamie
Bought by
Kear Jason
Current Estimated Value
Purchase Details
Closed on
Dec 23, 2005
Sold by
Hud
Bought by
Rasor Jason J and Briggs Brian S
Home Financials for this Owner
Home Financials are based on the most recent Mortgage that was taken out on this home.
Original Mortgage
$116,450
Interest Rate
6.48%
Mortgage Type
Fannie Mae Freddie Mac
Purchase Details
Closed on
Mar 19, 2003
Sold by
Smith Michael A and Regions Mortgage Inc
Bought by
Hud
Purchase Details
Closed on
Aug 1, 1996
Sold by
Borror Corp
Bought by
Smith Michael A and Smith Denise M
Home Financials for this Owner
Home Financials are based on the most recent Mortgage that was taken out on this home.
Original Mortgage
$116,462
Interest Rate
8.33%
Mortgage Type
FHA
Create a Home Valuation Report for This Property
The Home Valuation Report is an in-depth analysis detailing your home's value as well as a comparison with similar homes in the area
Home Values in the Area
Average Home Value in this Area
Purchase History
| Date | Buyer | Sale Price | Title Company |
|---|---|---|---|
| Kear Jason | $130,000 | Heart Of Ohio Title Co | |
| Rasor Jason J | $109,022 | Contract P | |
| Hud | $95,000 | -- | |
| Smith Michael A | $118,750 | -- |
Source: Public Records
Mortgage History
| Date | Status | Borrower | Loan Amount |
|---|---|---|---|
| Previous Owner | Rasor Jason J | $116,450 | |
| Previous Owner | Smith Michael A | $116,462 |
Source: Public Records
Tax History Compared to Growth
Tax History
| Year | Tax Paid | Tax Assessment Tax Assessment Total Assessment is a certain percentage of the fair market value that is determined by local assessors to be the total taxable value of land and additions on the property. | Land | Improvement |
|---|---|---|---|---|
| 2025 | $3,385 | $77,980 | $21,000 | $56,980 |
| 2024 | $3,385 | $77,980 | $21,000 | $56,980 |
| 2023 | $3,353 | $77,980 | $21,000 | $56,980 |
| 2022 | $2,302 | $44,530 | $5,780 | $38,750 |
| 2021 | $2,459 | $44,530 | $5,780 | $38,750 |
| 2020 | $2,313 | $44,530 | $5,780 | $38,750 |
| 2019 | $2,110 | $36,330 | $4,620 | $31,710 |
| 2018 | $2,205 | $36,330 | $4,620 | $31,710 |
| 2017 | $2,227 | $36,330 | $4,620 | $31,710 |
| 2016 | $2,323 | $35,220 | $6,900 | $28,320 |
| 2015 | $2,285 | $35,220 | $6,900 | $28,320 |
| 2014 | $2,311 | $35,220 | $6,900 | $28,320 |
| 2013 | $1,022 | $37,065 | $7,245 | $29,820 |
Source: Public Records
Map
Nearby Homes
- 2981 Stonebluff Dr
- 3669 Mathena Way
- 3100 Westaire Ct
- 2970 Askins Rd
- 2825 S Hampton Rd
- 3105 Wessex Ct
- 3811 Bay Village St
- 0 Wessex Ct
- 4375 Refugee Rd
- 3830 Charbonnett Ct Unit 6-A
- 2425 Mason Village Ct Unit 2425
- 2503 Burgandy Ln Unit 46A
- 3135 Easthaven Dr S
- 2275 Cardston Ct
- 2252 Meridian Ct
- 4485 Helen Dr
- 4479 Gerling Blvd
- 4486 Helen Dr
- St Martin Plan at Willow Reserve Townhomes
- St Martin Plan at Spangler Farms
- 3080 Stonebluff Dr
- 3104 Stonebluff Dr
- 3083 Remington Ridge Rd
- 3072 Stonebluff Dr
- 3089 Remington Ridge Rd
- 3077 Remington Ridge Rd
- 3071 Remington Ridge Rd
- 3081 Stonebluff Dr
- 3066 Stonebluff Dr
- 3095 Remington Ridge Rd
- 3075 Stonebluff Dr
- 3093 Stonebluff Dr
- 3069 Stonebluff Dr
- 3065 Remington Ridge Rd
- 3060 Stonebluff Dr
- 3099 Stonebluff Dr
- 3105 Stonebluff Dr
- 3063 Stonebluff Dr
- 3111 Stonebluff Dr
- 3054 Stonebluff Dr