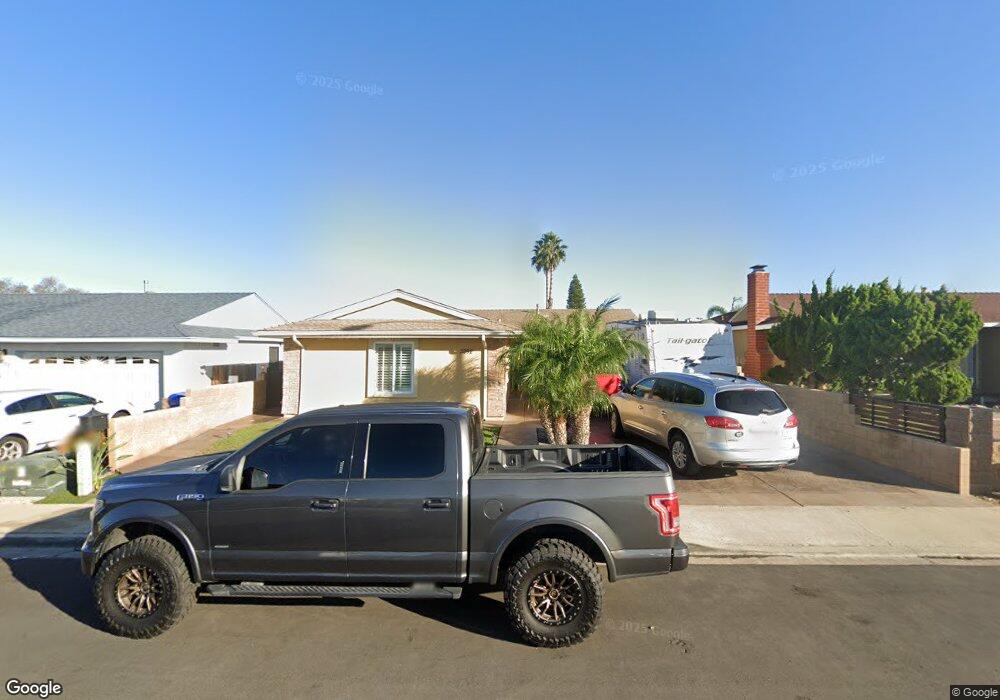
3092 Via Papeete San Diego, CA 92154
Otay Mesa West NeighborhoodEstimated Value: $766,702 - $845,000
3
Beds
2
Baths
1,698
Sq Ft
$469/Sq Ft
Est. Value
About This Home
This home is located at 3092 Via Papeete, San Diego, CA 92154 and is currently estimated at $795,676, approximately $468 per square foot. 3092 Via Papeete is a home located in San Diego County with nearby schools including Howard Pence Elementary School, Montgomery Middle School, and Montgomery Senior High School.
Ownership History
Date
Name
Owned For
Owner Type
Purchase Details
Closed on
Jan 27, 2005
Sold by
Araiza Maricela
Bought by
Araiza Roberto
Current Estimated Value
Home Financials for this Owner
Home Financials are based on the most recent Mortgage that was taken out on this home.
Original Mortgage
$346,000
Outstanding Balance
$178,405
Interest Rate
5.97%
Mortgage Type
Purchase Money Mortgage
Estimated Equity
$617,271
Purchase Details
Closed on
Jan 23, 2004
Sold by
Moran Ricardo
Bought by
Araiza Roberto and Araiza Maricela
Home Financials for this Owner
Home Financials are based on the most recent Mortgage that was taken out on this home.
Original Mortgage
$252,000
Interest Rate
6.49%
Mortgage Type
Purchase Money Mortgage
Purchase Details
Closed on
Oct 13, 2003
Sold by
Moran Ana M
Bought by
Moran Ricardo
Purchase Details
Closed on
Oct 3, 2003
Sold by
Cottom Melvin Ray and Cottom Elisa
Bought by
Moran Ricardo
Purchase Details
Closed on
May 16, 1985
Create a Home Valuation Report for This Property
The Home Valuation Report is an in-depth analysis detailing your home's value as well as a comparison with similar homes in the area
Home Values in the Area
Average Home Value in this Area
Purchase History
| Date | Buyer | Sale Price | Title Company |
|---|---|---|---|
| Araiza Roberto | -- | Gateway Title Company | |
| Araiza Roberto | -- | -- | |
| Araiza Roberto | $315,000 | First American Title Co | |
| Moran Ricardo | -- | Southland Title | |
| Moran Ricardo | $315,000 | Southland Title | |
| -- | $84,000 | -- |
Source: Public Records
Mortgage History
| Date | Status | Borrower | Loan Amount |
|---|---|---|---|
| Open | Araiza Roberto | $346,000 | |
| Closed | Araiza Roberto | $252,000 | |
| Closed | Araiza Roberto | $63,000 |
Source: Public Records
Tax History Compared to Growth
Tax History
| Year | Tax Paid | Tax Assessment Tax Assessment Total Assessment is a certain percentage of the fair market value that is determined by local assessors to be the total taxable value of land and additions on the property. | Land | Improvement |
|---|---|---|---|---|
| 2025 | $5,458 | $482,890 | $255,914 | $226,976 |
| 2024 | $5,458 | $473,423 | $250,897 | $222,526 |
| 2023 | $5,416 | $464,141 | $245,978 | $218,163 |
| 2022 | $5,311 | $455,041 | $241,155 | $213,886 |
| 2021 | $5,145 | $446,120 | $236,427 | $209,693 |
| 2020 | $5,024 | $441,546 | $234,003 | $207,543 |
| 2019 | $5,019 | $432,889 | $229,415 | $203,474 |
| 2018 | $4,933 | $424,402 | $224,917 | $199,485 |
| 2017 | $4,700 | $405,000 | $194,000 | $211,000 |
| 2016 | $4,109 | $360,000 | $173,000 | $187,000 |
| 2015 | $4,048 | $350,000 | $169,000 | $181,000 |
| 2014 | $3,590 | $310,000 | $150,000 | $160,000 |
Source: Public Records
Map
Nearby Homes
- 856 Orchid Way
- 1029 Reef Dr
- 768 Picador Blvd
- 3443 Alonquin Way
- 931 Madden Ave
- 3470 Robb Roy Place
- 3124 Caminito Quixote
- 3206 Caminito Quixote
- 1011 Beyer Way Unit 32
- 3095 Camino Aleta
- 3340 Del Sol Blvd Unit 268
- 3340 Del Sol Blvd Unit 144
- 3340 Del Sol Blvd Unit SPC 126
- 3340 Del Sol Blvd Unit 125
- 3340 Del Sol Blvd Unit 111
- 3340 Del Sol Blvd Unit 196
- 3340 Del Sol Blvd Unit 198
- 3340 Del Sol Blvd Unit 227
- 3340 Del Sol Blvd Unit 117
- 3340 Del Sol Blvd Unit 21
- 3108 Via Papeete
- 3082 Via Papeete
- 3124 Via Papeete
- 3072 Via Papeete
- 3087 Pitcairn St
- 3097 Pitcairn St
- 3077 Pitcairn St
- 3115 Pitcairn St
- 806 Orchid Way
- 3140 Via Papeete
- 3062 Via Papeete
- 3069 Pitcairn St
- 805 Orchid Way
- 3129 Pitcairn St
- 816 Orchid Way
- 3061 Pitcairn St
- 805 Hawaii Ave
- 3158 Via Papeete
- 815 Orchid Way
- 3052 Via Papeete