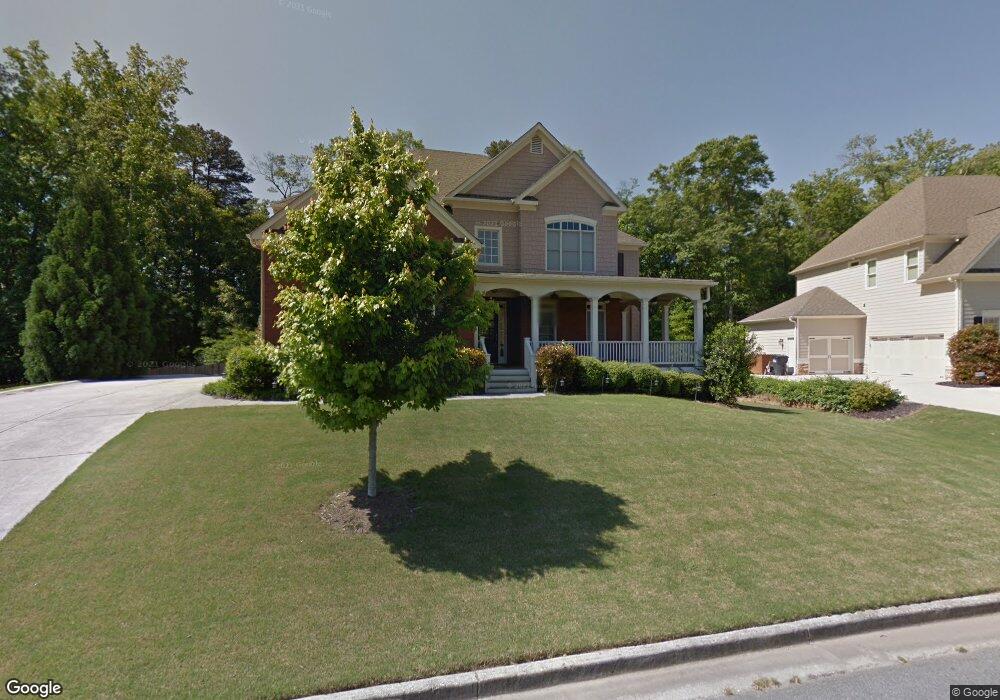
3093 Addie Pond Way SW Marietta, GA 30064
West Cobb NeighborhoodEstimated Value: $769,000 - $898,000
6
Beds
5
Baths
3,687
Sq Ft
$228/Sq Ft
Est. Value
About This Home
This home is located at 3093 Addie Pond Way SW, Marietta, GA 30064 and is currently estimated at $839,250, approximately $227 per square foot. 3093 Addie Pond Way SW is a home located in Cobb County with nearby schools including Dowell Elementary School, Hillgrove High School, and Riverstone Montessori Academy.
Ownership History
Date
Name
Owned For
Owner Type
Purchase Details
Closed on
Apr 17, 2013
Sold by
Angeli Samantha
Bought by
Angeli Jayson and Angeli Samantha
Current Estimated Value
Home Financials for this Owner
Home Financials are based on the most recent Mortgage that was taken out on this home.
Original Mortgage
$133,000
Outstanding Balance
$28,283
Interest Rate
3.59%
Mortgage Type
New Conventional
Estimated Equity
$810,967
Purchase Details
Closed on
May 17, 2010
Sold by
Murphy Brendon W
Bought by
Shorr Samantha and Angeli Jayson
Purchase Details
Closed on
Jan 7, 2005
Sold by
Jeff A Hedden Builders Cp Llc
Bought by
Murphy Brendon W
Home Financials for this Owner
Home Financials are based on the most recent Mortgage that was taken out on this home.
Original Mortgage
$39,700
Interest Rate
5.61%
Mortgage Type
New Conventional
Create a Home Valuation Report for This Property
The Home Valuation Report is an in-depth analysis detailing your home's value as well as a comparison with similar homes in the area
Home Values in the Area
Average Home Value in this Area
Purchase History
| Date | Buyer | Sale Price | Title Company |
|---|---|---|---|
| Angeli Jayson | $435,000 | -- | |
| Shorr Samantha | $435,000 | -- | |
| Murphy Brendon W | $397,900 | -- | |
| Jeff A Hedden Builders Cp Llc | $81,500 | -- |
Source: Public Records
Mortgage History
| Date | Status | Borrower | Loan Amount |
|---|---|---|---|
| Open | Angeli Jayson | $133,000 | |
| Previous Owner | Jeff A Hedden Builders Cp Llc | $39,700 | |
| Previous Owner | Jeff A Hedden Builders Cp Llc | $318,300 |
Source: Public Records
Tax History Compared to Growth
Tax History
| Year | Tax Paid | Tax Assessment Tax Assessment Total Assessment is a certain percentage of the fair market value that is determined by local assessors to be the total taxable value of land and additions on the property. | Land | Improvement |
|---|---|---|---|---|
| 2024 | $7,278 | $280,288 | $40,000 | $240,288 |
| 2023 | $6,735 | $280,288 | $40,000 | $240,288 |
| 2022 | $7,332 | $280,288 | $40,000 | $240,288 |
| 2021 | $5,789 | $209,808 | $40,000 | $169,808 |
| 2020 | $5,681 | $204,872 | $39,200 | $165,672 |
| 2019 | $5,681 | $204,872 | $39,200 | $165,672 |
| 2018 | $5,681 | $204,872 | $39,200 | $165,672 |
| 2017 | $4,760 | $174,712 | $37,240 | $137,472 |
| 2016 | $4,761 | $174,712 | $37,240 | $137,472 |
| 2015 | $4,858 | $173,720 | $37,240 | $136,480 |
| 2014 | $4,899 | $173,720 | $0 | $0 |
Source: Public Records
Map
Nearby Homes
- 2866 Wynford Dr SW Unit 2
- 1237 Wynford Woods SW
- 3006 Coffman Ct SW
- 1234 Wynford Colony SW
- 1204 Commonwealth Ave SW
- 1567 Vine Leaf Dr
- 1004 Villa Rica Rd SW
- 1518 Sage Ridge Dr
- 950 Steadman Terrace SW
- 3057 Hallman Cir SW
- 946 Steadman Terrace SW
- 3061 Hallman Cir SW
- 719 Crossroad SW
- 1209 Wilkes Way SW Unit 1
- 895 Ovalene Ln SW
- 818 Andora Way SW
- 3416 N Cook Rd
- 1765 Dew Place
- 0 Friendship Church Rd SW Unit 10510111
- 0 Friendship Church Rd SW Unit 7569463
- 3097 Addie Pond Way SW
- 3089 Addie Pond Way SW
- 3026 Wynford Station SW Unit 2
- 3088 Addie Pond Way SW
- 3101 Addie Pond Way SW
- 3028 Wynford Station SW
- 3024 Wynford Station SW
- 3092 Addie Pond Way SW
- 3085 Addie Pond Way SW
- 3030 Wynford Station SW
- 3022 Wynford Station SW
- 3105 Addie Pond Way SW
- 3096 Addie Pond Way SW
- 3080 Addie Pond Way SW
- 3081 Addie Pond Way SW
- 3032 Wynford Station SW
- 1301 Wynford Colony SW
- 3109 Addie Pond Way SW
- 1182 Beebe Ln SW
- 3020 Wynford Station SW