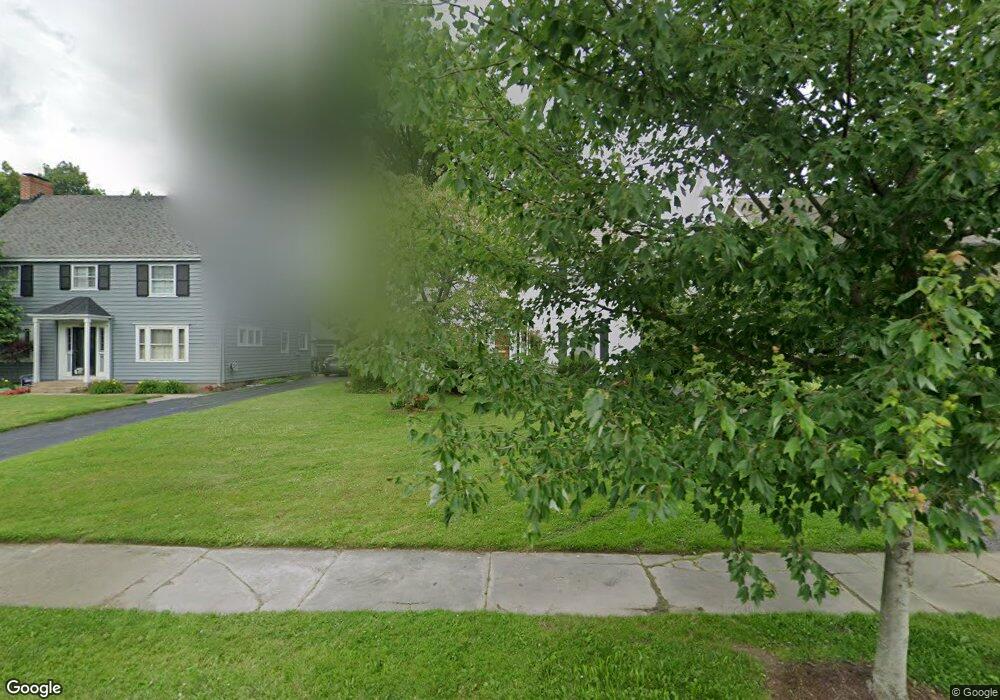
3093 Warrington Rd Cleveland, OH 44120
Estimated Value: $419,550 - $451,000
3
Beds
2
Baths
2,632
Sq Ft
$164/Sq Ft
Est. Value
About This Home
This home is located at 3093 Warrington Rd, Cleveland, OH 44120 and is currently estimated at $432,388, approximately $164 per square foot. 3093 Warrington Rd is a home located in Cuyahoga County with nearby schools including Onaway Elementary School, Woodbury Elementary School, and Shaker Heights Middle School.
Ownership History
Date
Name
Owned For
Owner Type
Purchase Details
Closed on
Jul 31, 2017
Sold by
Clegg Kathleen A
Bought by
Clegg Kathleen A and Cheren Mark I
Current Estimated Value
Purchase Details
Closed on
Mar 29, 1995
Sold by
Miller Steven H
Bought by
Clegg Kathleen A
Home Financials for this Owner
Home Financials are based on the most recent Mortgage that was taken out on this home.
Original Mortgage
$121,600
Interest Rate
8.91%
Mortgage Type
New Conventional
Purchase Details
Closed on
Dec 2, 1991
Sold by
Lasersohn Nancy
Bought by
Miller Steven H
Purchase Details
Closed on
Aug 23, 1977
Sold by
Repert Richard E and Repert Jacklyn K
Bought by
Lasersohn Nancy
Purchase Details
Closed on
Jul 1, 1975
Sold by
Pyle Bette Jane
Bought by
Repert Richard E and Repert Jacklyn K
Purchase Details
Closed on
Jan 1, 1975
Bought by
Pyle Bette Jane
Create a Home Valuation Report for This Property
The Home Valuation Report is an in-depth analysis detailing your home's value as well as a comparison with similar homes in the area
Home Values in the Area
Average Home Value in this Area
Purchase History
| Date | Buyer | Sale Price | Title Company |
|---|---|---|---|
| Clegg Kathleen A | -- | None Available | |
| Clegg Kathleen A | $152,000 | -- | |
| Miller Steven H | $125,000 | -- | |
| Lasersohn Nancy | $58,000 | -- | |
| Repert Richard E | $44,000 | -- | |
| Pyle Bette Jane | -- | -- |
Source: Public Records
Mortgage History
| Date | Status | Borrower | Loan Amount |
|---|---|---|---|
| Closed | Clegg Kathleen A | $121,600 |
Source: Public Records
Tax History Compared to Growth
Tax History
| Year | Tax Paid | Tax Assessment Tax Assessment Total Assessment is a certain percentage of the fair market value that is determined by local assessors to be the total taxable value of land and additions on the property. | Land | Improvement |
|---|---|---|---|---|
| 2024 | $10,962 | $122,780 | $24,465 | $98,315 |
| 2023 | $9,800 | $86,950 | $17,470 | $69,480 |
| 2022 | $9,524 | $86,940 | $17,470 | $69,480 |
| 2021 | $9,492 | $86,940 | $17,470 | $69,480 |
| 2020 | $9,426 | $81,240 | $16,310 | $64,930 |
| 2019 | $9,291 | $232,100 | $46,600 | $185,500 |
| 2018 | $562 | $81,240 | $16,310 | $64,930 |
| 2017 | $8,698 | $71,860 | $13,620 | $58,240 |
| 2016 | $8,350 | $71,860 | $13,620 | $58,240 |
| 2015 | $7,878 | $71,860 | $13,620 | $58,240 |
| 2014 | $7,878 | $65,310 | $12,390 | $52,920 |
Source: Public Records
Map
Nearby Homes
- 3027 Warrington Rd
- 3077 Huntington Rd
- 14605 S Woodland Rd
- 3155 Ludlow Rd
- 0 Van Aken Blvd Unit 5021037
- 3180 Chadbourne Rd
- 2917 Warrington Rd
- 14429 Onaway Rd
- 3190 Warrington Rd
- 3133 Albion Rd
- 14702 Milverton Rd
- 3264 E 149th St
- 3261 E 147th St
- 14506 Milverton Rd
- 3060 Keswick Rd
- 3127 Becket Rd
- 3283 Van Aken Blvd
- 3291 E 145th St
- 3294 E 146th St
- 3267 E 142nd St
- 3101 Warrington Rd
- 3089 Warrington Rd
- 3085 Warrington Rd
- 3105 Warrington Rd
- 3072 Huntington Rd
- 3076 Huntington Rd
- 3068 Huntington Rd
- 3081 Warrington Rd
- 3107 Warrington Rd
- 3078 Huntington Rd
- 3062 Huntington Rd
- 3096 Warrington Rd
- 3090 Warrington Rd
- 3100 Warrington Rd
- 3086 Warrington Rd
- 3102 Warrington Rd
- 3086 Huntington Rd
- 3058 Huntington Rd
- 3109 Warrington Rd
- 3075 Warrington Rd