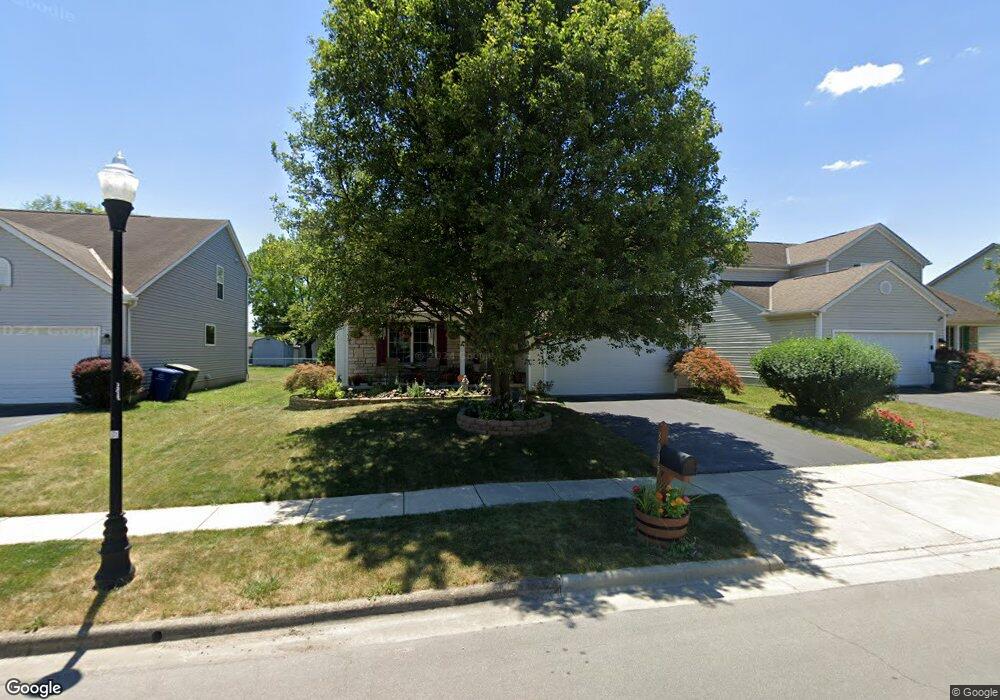
3095 Gideon Ln Columbus, OH 43219
Somerset NeighborhoodEstimated Value: $362,063 - $423,000
3
Beds
3
Baths
1,944
Sq Ft
$198/Sq Ft
Est. Value
About This Home
This home is located at 3095 Gideon Ln, Columbus, OH 43219 and is currently estimated at $384,766, approximately $197 per square foot. 3095 Gideon Ln is a home located in Franklin County with nearby schools including Cassady Elementary School, Mifflin Middle School, and Mifflin High School.
Ownership History
Date
Name
Owned For
Owner Type
Purchase Details
Closed on
Oct 26, 2020
Sold by
Kelly Vincent J
Bought by
Kelly Vincent J and Staats Curtis E
Current Estimated Value
Home Financials for this Owner
Home Financials are based on the most recent Mortgage that was taken out on this home.
Original Mortgage
$136,500
Outstanding Balance
$98,595
Interest Rate
2.8%
Mortgage Type
New Conventional
Estimated Equity
$286,171
Purchase Details
Closed on
Mar 16, 2010
Sold by
Staats Curtis W
Bought by
Kelly Vincent J
Purchase Details
Closed on
Dec 13, 2002
Sold by
Dominion Homes Inc
Bought by
Kelly Vincent J and Staats Curtis W
Home Financials for this Owner
Home Financials are based on the most recent Mortgage that was taken out on this home.
Original Mortgage
$193,394
Interest Rate
6.01%
Mortgage Type
FHA
Create a Home Valuation Report for This Property
The Home Valuation Report is an in-depth analysis detailing your home's value as well as a comparison with similar homes in the area
Home Values in the Area
Average Home Value in this Area
Purchase History
| Date | Buyer | Sale Price | Title Company |
|---|---|---|---|
| Kelly Vincent J | $83,500 | Landsel Title Agency Inc | |
| Kelly Vincent J | $110,000 | Attorney | |
| Kelly Vincent J | $195,600 | Alliance Title |
Source: Public Records
Mortgage History
| Date | Status | Borrower | Loan Amount |
|---|---|---|---|
| Open | Kelly Vincent J | $136,500 | |
| Previous Owner | Kelly Vincent J | $193,394 |
Source: Public Records
Tax History Compared to Growth
Tax History
| Year | Tax Paid | Tax Assessment Tax Assessment Total Assessment is a certain percentage of the fair market value that is determined by local assessors to be the total taxable value of land and additions on the property. | Land | Improvement |
|---|---|---|---|---|
| 2024 | $4,661 | $103,850 | $27,580 | $76,270 |
| 2023 | $4,601 | $103,845 | $27,580 | $76,265 |
| 2022 | $3,823 | $73,710 | $15,330 | $58,380 |
| 2021 | $3,830 | $73,710 | $15,330 | $58,380 |
| 2020 | $3,835 | $73,710 | $15,330 | $58,380 |
| 2019 | $3,546 | $58,450 | $12,250 | $46,200 |
| 2018 | $3,379 | $58,450 | $12,250 | $46,200 |
| 2017 | $3,544 | $58,450 | $12,250 | $46,200 |
| 2016 | $3,547 | $53,550 | $13,440 | $40,110 |
| 2015 | $3,220 | $53,550 | $13,440 | $40,110 |
| 2014 | $3,228 | $53,550 | $13,440 | $40,110 |
| 2013 | $1,675 | $56,350 | $14,140 | $42,210 |
Source: Public Records
Map
Nearby Homes
- 2795 Marbella Place
- 2731 Gatewood Rd
- 3241 Kenray Dr
- 3221 Caralee Dr
- 3391 Compton Dr
- 3427 Crossing Hill Way
- 0 Agler Rd Unit 224000625
- 2536 Sunbury Dr
- 2995 Blakehope Dr
- 2520 Mccutcheon Rd
- 0 Club House Dr
- 2683 Club House Dr
- 3096 Leon Ave
- 2457 Ashpoint St
- 2781 Innis Rd Unit C
- 2781 Innis Rd Unit F
- 3335 Sycamore Knoll Dr
- 3678 Ashridge St
- 2559 Milford Ave
- 3601 Agler Rd
- 3103 Gideon Ln
- 3111 Gideon Ln
- 3081 Gideon Ln
- 3094 Elmreeb Dr
- 3102 Elmreeb Dr
- 3086 Elmreeb Dr
- 2813 Zach Dr
- 3119 Gideon Ln
- 3110 Elmreeb Dr
- 2756 Lidell Place
- 3075 Gideon Ln
- 3112 Gideon Ln
- 2808 Marbella Place
- 3118 Elmreeb Dr
- 3127 Gideon Ln
- 2821 Zach Dr
- 3120 Gideon Ln
- 3130 Elmreeb Dr
- 2816 Marbella Place
- 3135 Gideon Ln