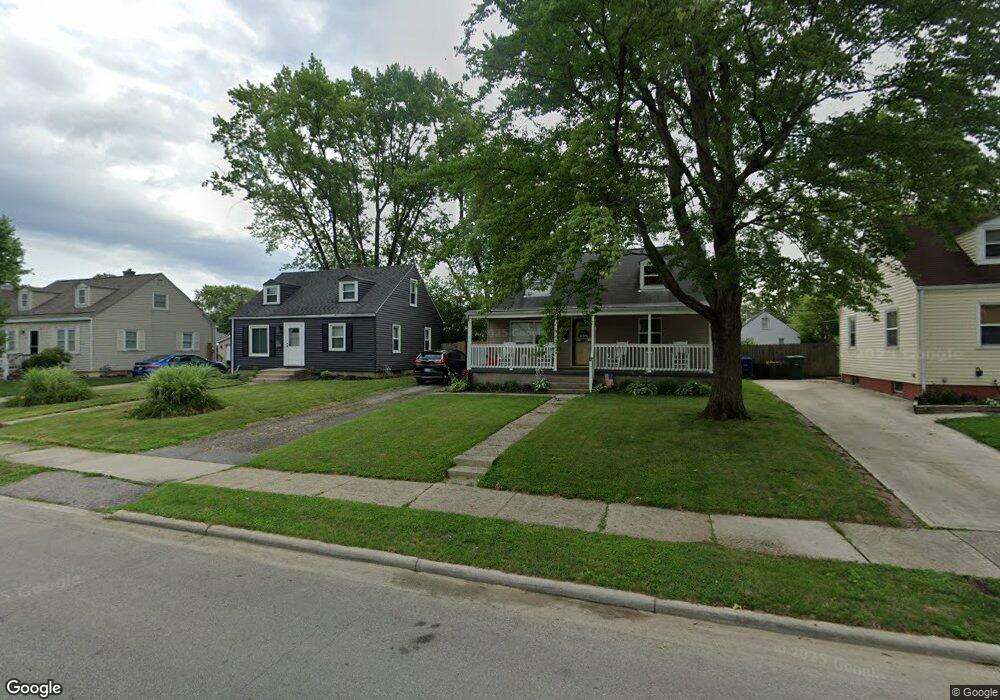
3096 Hiawatha St Columbus, OH 43224
North Linden NeighborhoodEstimated Value: $205,245 - $227,000
3
Beds
1
Bath
1,091
Sq Ft
$200/Sq Ft
Est. Value
About This Home
This home is located at 3096 Hiawatha St, Columbus, OH 43224 and is currently estimated at $218,311, approximately $200 per square foot. 3096 Hiawatha St is a home located in Franklin County with nearby schools including Como Elementary School, Dominion Middle School, and Whetstone High School.
Ownership History
Date
Name
Owned For
Owner Type
Purchase Details
Closed on
Jun 4, 2020
Sold by
Redman Michael A
Bought by
Richardson Piper Alexis
Current Estimated Value
Home Financials for this Owner
Home Financials are based on the most recent Mortgage that was taken out on this home.
Original Mortgage
$155,200
Outstanding Balance
$137,573
Interest Rate
3.2%
Mortgage Type
New Conventional
Estimated Equity
$80,738
Purchase Details
Closed on
Jun 30, 2005
Sold by
Denney Randy Gene and Denney Sue Ellen
Bought by
Redman Michael A
Home Financials for this Owner
Home Financials are based on the most recent Mortgage that was taken out on this home.
Original Mortgage
$70,000
Interest Rate
5.75%
Mortgage Type
Fannie Mae Freddie Mac
Purchase Details
Closed on
Jan 30, 1979
Bought by
Denney Randy G
Create a Home Valuation Report for This Property
The Home Valuation Report is an in-depth analysis detailing your home's value as well as a comparison with similar homes in the area
Home Values in the Area
Average Home Value in this Area
Purchase History
| Date | Buyer | Sale Price | Title Company |
|---|---|---|---|
| Richardson Piper Alexis | $160,000 | Great American Title | |
| Redman Michael A | $70,000 | Christopher | |
| Denney Randy G | $29,500 | -- |
Source: Public Records
Mortgage History
| Date | Status | Borrower | Loan Amount |
|---|---|---|---|
| Open | Richardson Piper Alexis | $155,200 | |
| Previous Owner | Redman Michael A | $70,000 |
Source: Public Records
Tax History Compared to Growth
Tax History
| Year | Tax Paid | Tax Assessment Tax Assessment Total Assessment is a certain percentage of the fair market value that is determined by local assessors to be the total taxable value of land and additions on the property. | Land | Improvement |
|---|---|---|---|---|
| 2024 | $3,005 | $66,960 | $14,320 | $52,640 |
| 2023 | $2,967 | $66,955 | $14,315 | $52,640 |
| 2022 | $1,995 | $38,470 | $6,860 | $31,610 |
| 2021 | $1,999 | $38,470 | $6,860 | $31,610 |
| 2020 | $1,701 | $32,690 | $6,860 | $25,830 |
| 2019 | $1,654 | $27,270 | $5,740 | $21,530 |
| 2018 | $1,543 | $27,270 | $5,740 | $21,530 |
| 2017 | $1,653 | $27,270 | $5,740 | $21,530 |
| 2016 | $1,582 | $23,880 | $4,240 | $19,640 |
| 2015 | $1,436 | $23,880 | $4,240 | $19,640 |
| 2014 | $1,440 | $23,880 | $4,240 | $19,640 |
| 2013 | $788 | $26,495 | $4,690 | $21,805 |
Source: Public Records
Map
Nearby Homes
- 3105 Atwood Terrace
- 3087 Hiawatha St
- 2996 Atwood Terrace
- 3043 McGuffey Rd
- 3129 McGuffey Rd
- 2950 Grasmere Ave
- 2899 Howey Rd
- 2923 Azelda St
- 2888 Howey Rd
- 3071 Karl Rd
- 826 E Brighton Rd
- 1247 Weldon Ave
- 1225 Sandlin Ave
- 2860 Grasmere Ave
- 3107 Hamilton Ave
- 788 E Brighton Rd
- 1126 Piedmont Rd
- 3268 McGuffey Rd
- 759 E Longview Ave
- 2816 Azelda St
- 3088 Hiawatha St
- 3102 Hiawatha St
- 3082 Hiawatha St
- 3108 Hiawatha St
- 3087 Atwood Terrace
- 3081 Atwood Terrace
- 3114 Hiawatha St
- 3093 Atwood Terrace
- 3076 Hiawatha St
- 3075 Atwood Terrace
- 3099 Atwood Terrace
- 3095 Hiawatha St
- 3101 Hiawatha St
- 3065 Atwood Terrace
- 3107 Hiawatha St
- 3081 Hiawatha St
- 3064 Hiawatha St
- 3113 Hiawatha St
- 1047 Carlisle Ave
- 3126 Hiawatha St