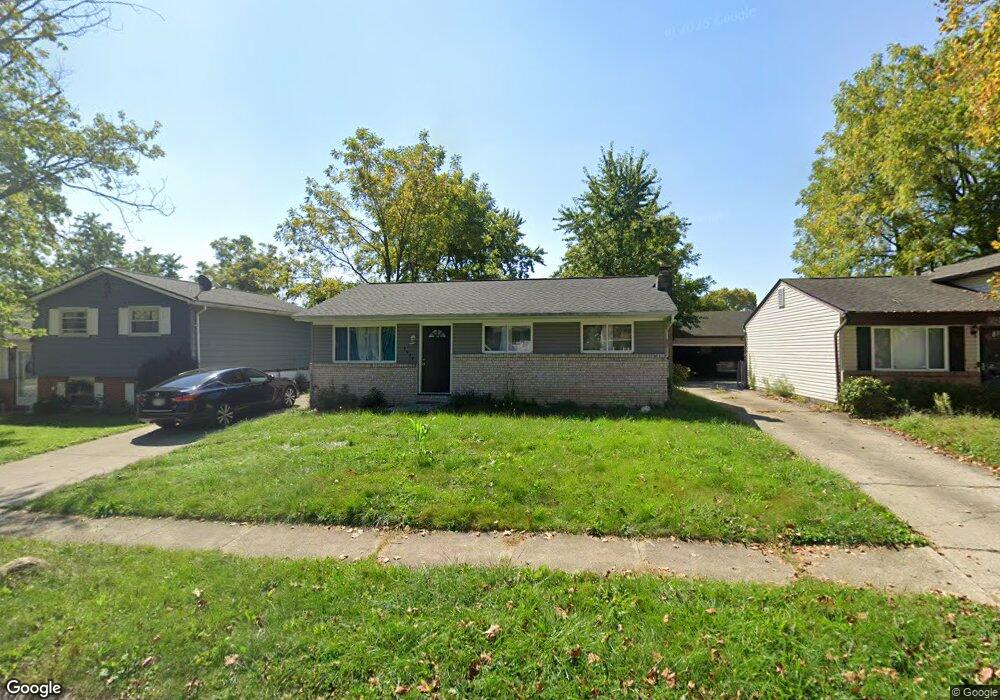
3099 Wallingford Ave Columbus, OH 43231
Parkview NeighborhoodEstimated Value: $213,701 - $260,000
3
Beds
1
Bath
945
Sq Ft
$252/Sq Ft
Est. Value
About This Home
This home is located at 3099 Wallingford Ave, Columbus, OH 43231 and is currently estimated at $238,425, approximately $252 per square foot. 3099 Wallingford Ave is a home located in Franklin County with nearby schools including Hawthorne Elementary School, Heritage Middle School, and Westerville South High School.
Ownership History
Date
Name
Owned For
Owner Type
Purchase Details
Closed on
Aug 14, 2003
Sold by
Burris Matthew P
Bought by
Tyler Fern E and Fern Elizabeth Tyler Trust
Current Estimated Value
Purchase Details
Closed on
Sep 5, 2002
Sold by
Estate Of Edna M Edinger
Bought by
Burris Matthew P
Purchase Details
Closed on
Aug 28, 1999
Sold by
Daugherty Barbara J and Daugherty James P
Bought by
Edinger Edna M
Purchase Details
Closed on
Aug 23, 1999
Sold by
Mcnutt Rose M
Bought by
Edinger Edna M
Purchase Details
Closed on
Aug 19, 1999
Sold by
Edinger John T and Edinger Darlene M
Bought by
Edinger Edna M
Purchase Details
Closed on
Aug 11, 1999
Sold by
Estate Of Theodore M Edinger
Bought by
Edinger Edna M and Daugherty Barbara J
Purchase Details
Closed on
Jun 11, 1998
Sold by
Martin Bellona B
Bought by
Edinger Edna M and Edinger Theodore M
Purchase Details
Closed on
Jul 22, 1997
Sold by
Martin Michael J
Bought by
Martin Bellona B
Purchase Details
Closed on
Jan 22, 1991
Create a Home Valuation Report for This Property
The Home Valuation Report is an in-depth analysis detailing your home's value as well as a comparison with similar homes in the area
Home Values in the Area
Average Home Value in this Area
Purchase History
| Date | Buyer | Sale Price | Title Company |
|---|---|---|---|
| Tyler Fern E | $73,300 | -- | |
| Burris Matthew P | -- | -- | |
| Edinger Edna M | -- | -- | |
| Edinger Edna M | -- | -- | |
| Edinger Edna M | -- | -- | |
| Edinger Edna M | -- | -- | |
| Edinger Edna M | $77,000 | -- | |
| Martin Bellona B | -- | -- | |
| -- | $59,500 | -- |
Source: Public Records
Tax History Compared to Growth
Tax History
| Year | Tax Paid | Tax Assessment Tax Assessment Total Assessment is a certain percentage of the fair market value that is determined by local assessors to be the total taxable value of land and additions on the property. | Land | Improvement |
|---|---|---|---|---|
| 2024 | $3,380 | $65,880 | $22,580 | $43,300 |
| 2023 | $3,284 | $65,870 | $22,575 | $43,295 |
| 2022 | $3,779 | $37,450 | $9,940 | $27,510 |
| 2021 | $2,631 | $37,450 | $9,940 | $27,510 |
| 2020 | $2,461 | $37,450 | $9,940 | $27,510 |
| 2019 | $2,156 | $31,230 | $8,300 | $22,930 |
| 2018 | $2,006 | $31,230 | $8,300 | $22,930 |
| 2017 | $2,203 | $31,230 | $8,300 | $22,930 |
| 2016 | $1,898 | $25,550 | $9,170 | $16,380 |
| 2015 | $1,902 | $25,550 | $9,170 | $16,380 |
| 2014 | $1,903 | $25,550 | $9,170 | $16,380 |
| 2013 | $1,010 | $27,230 | $9,170 | $18,060 |
Source: Public Records
Map
Nearby Homes
- 3098 Bennington Ave
- 3010 Bennington Ave
- 4279 Morsetown Ct
- 4266 Morsetown Ct
- 3378 Trail Lane Ct
- 4246 Morsetowne Ct E
- 3392 Trail Lane Ct
- 4169 Commander Ln
- 3084 Omega Dr
- 2691 Northwold Rd
- 2977 Ironstone Dr
- 4444 Trindel Way
- 2903 Kilbourne Ave
- 4216 Grayfriars Ln
- 0 Ashbury Rd
- 3491 Headford Ct
- 2625 Clybourne Rd
- 2974 Footloose Dr
- 0 Abington Rd Unit 224031739
- 0 Abington Rd Unit 224031704
- 3105 Wallingford Ave
- 3093 Wallingford Ave
- 3111 Wallingford Ave
- 3087 Wallingford Ave
- 4454 Glenshaw Place
- 3081 Wallingford Ave
- 3098 Glenshaw Ave
- 3090 Glenshaw Ave
- 4446 Glenshaw Place
- 3106 Glenshaw Ave
- 3108 Wallingford Ave
- 3102 Wallingford Ave
- 4460 Glenshaw Place
- 3116 Wallingford Ave
- 3077 Wallingford Ave
- 3096 Wallingford Ave
- 3120 Glenshaw Ave
- 3120 Wallingford Ave
- 3090 Wallingford Ave
- 3080 Glenshaw Ave