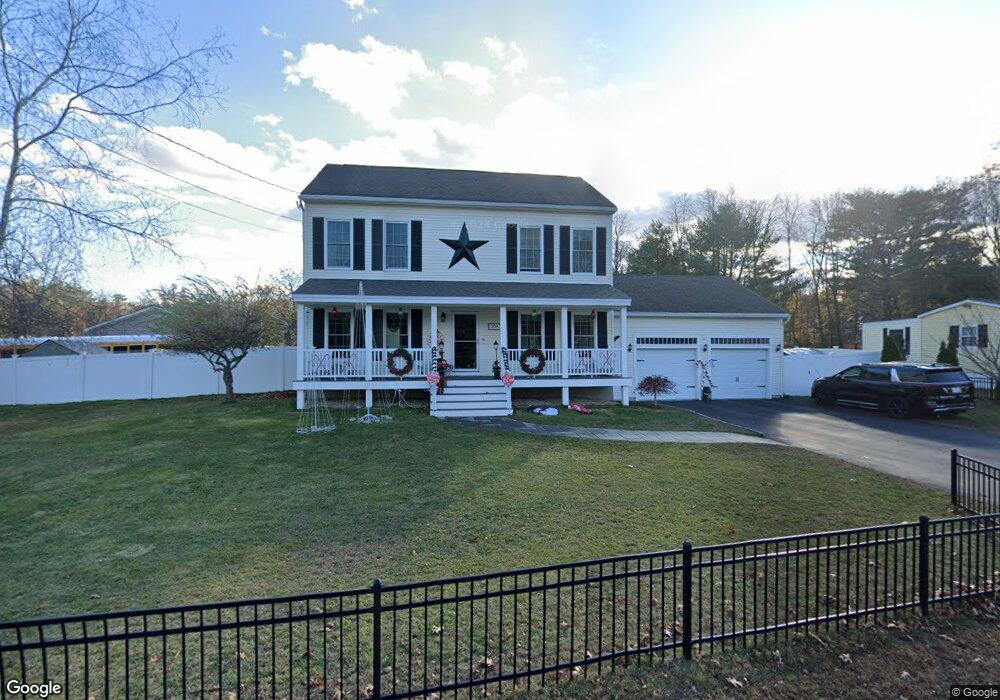
30A Brooks Rd Seabrook, NH 03874
Estimated Value: $521,000 - $592,000
3
Beds
3
Baths
1,768
Sq Ft
$320/Sq Ft
Est. Value
About This Home
This home is located at 30A Brooks Rd, Seabrook, NH 03874 and is currently estimated at $566,023, approximately $320 per square foot. 30A Brooks Rd is a home located in Rockingham County with nearby schools including Seabrook Elementary School, Seabrook Middle School, and Winnacunnet High School.
Ownership History
Date
Name
Owned For
Owner Type
Purchase Details
Closed on
Mar 31, 2025
Sold by
Sorrentino Danielle and Sorrentino Heather
Bought by
Sorrentino Ft and Sorrentino
Current Estimated Value
Purchase Details
Closed on
Jul 24, 2013
Sold by
Sorrentino Danielle
Bought by
Sorrentino Danielle and Felch Heather M
Purchase Details
Closed on
Jul 8, 2013
Sold by
Real Deal Props Llc
Bought by
Sorrentino Danielle
Purchase Details
Closed on
Apr 16, 2013
Sold by
Us Bank Na Tr
Bought by
Real Deal Props Llc
Purchase Details
Closed on
Jun 11, 2012
Sold by
Gill Angela M and Us Bank Na Tr
Bought by
Us Bank Na Tr
Purchase Details
Closed on
Apr 19, 2005
Sold by
William C Mcclellan Ho
Bought by
Gill Angela M and Gill Michael E
Create a Home Valuation Report for This Property
The Home Valuation Report is an in-depth analysis detailing your home's value as well as a comparison with similar homes in the area
Home Values in the Area
Average Home Value in this Area
Purchase History
| Date | Buyer | Sale Price | Title Company |
|---|---|---|---|
| Sorrentino Ft | -- | None Available | |
| Sorrentino Ft | -- | None Available | |
| Sorrentino Danielle | -- | -- | |
| Sorrentino Danielle | -- | -- | |
| Sorrentino Danielle | $260,000 | -- | |
| Sorrentino Danielle | $260,000 | -- | |
| Real Deal Props Llc | $147,000 | -- | |
| Real Deal Props Llc | $147,000 | -- | |
| Us Bank Na Tr | $180,400 | -- | |
| Us Bank Na Tr | $180,400 | -- | |
| Gill Angela M | $334,900 | -- | |
| Gill Angela M | $334,900 | -- |
Source: Public Records
Mortgage History
| Date | Status | Borrower | Loan Amount |
|---|---|---|---|
| Previous Owner | Gill Angela M | $297,600 | |
| Previous Owner | Gill Angela M | $74,400 |
Source: Public Records
Tax History
| Year | Tax Paid | Tax Assessment Tax Assessment Total Assessment is a certain percentage of the fair market value that is determined by local assessors to be the total taxable value of land and additions on the property. | Land | Improvement |
|---|---|---|---|---|
| 2024 | $5,934 | $506,300 | $209,100 | $297,200 |
| 2023 | $6,045 | $400,600 | $170,400 | $230,200 |
| 2022 | $5,308 | $400,600 | $170,400 | $230,200 |
| 2021 | $5,287 | $385,100 | $154,900 | $230,200 |
| 2020 | $4,920 | $308,100 | $124,000 | $184,100 |
| 2019 | $4,853 | $308,100 | $124,000 | $184,100 |
| 2018 | $4,838 | $297,700 | $113,600 | $184,100 |
| 2017 | $4,529 | $278,700 | $94,600 | $184,100 |
| 2016 | $4,017 | $271,600 | $94,600 | $177,000 |
| 2015 | $3,740 | $252,900 | $88,600 | $164,300 |
| 2014 | $3,804 | $249,100 | $88,600 | $160,500 |
| 2013 | $3,602 | $235,900 | $88,600 | $147,300 |
Source: Public Records
Map
Nearby Homes
- 35 Brooks Rd Unit 1
- 6 Janvrin Dr
- 241 & 245 Lafayette Rd
- 151 Walton Rd
- 6 Forest Dr
- 167 Staples St
- 188 Lafayette Rd
- 176 Lower Collins St
- 69 Nashville St
- 19 Viola Cir
- 4 Woodland Ave
- 154 Lafayette Rd
- 7 Toll Rd
- 42 Kendell Ln
- 6 Mason Ln
- 25 Bayberry Ln
- 64 Seabrook Rd
- 44 Seabrook Rd
- 47 Scott Ave
- 14 Seabrook Rd
- 30a Brooks Road Extension
- 30 Brooks Road Extension
- 31 Brooks Rd
- 27 Brooks Road Extension
- 33 Brooks Road Extension
- 31 Brooks Road Extension
- 25 Brooks Road Extension
- 24 Brooks Rd
- 11 Brooks Rd
- 25 Brooks Rd
- 34 Brooks Road Extension
- 32 Brooks Road Extension
- 32 Brooks Road Extension
- 17 Brooks Rd
- 34 Brooks Rd
- 11 Janvrin Dr
- 10 Janvrin Dr
- 10 Brooks Rd
- 9 Janvrin Dr
Your Personal Tour Guide
Ask me questions while you tour the home.