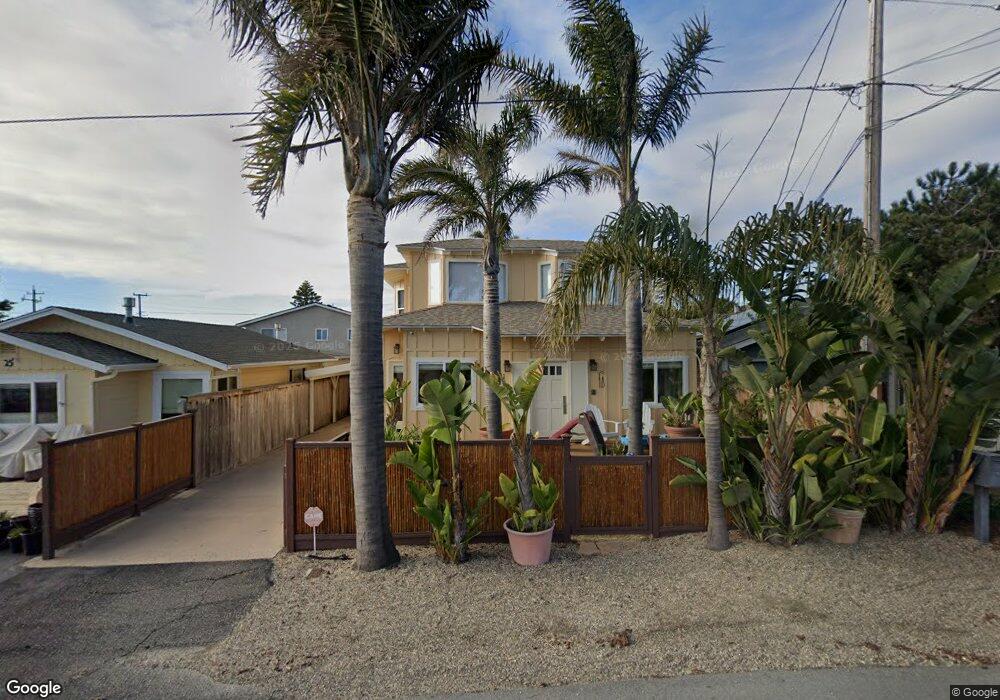
31 17th St Cayucos, CA 93430
Cayucos NeighborhoodEstimated Value: $1,326,224 - $1,664,000
3
Beds
3
Baths
1,067
Sq Ft
$1,385/Sq Ft
Est. Value
About This Home
This home is located at 31 17th St, Cayucos, CA 93430 and is currently estimated at $1,477,806, approximately $1,385 per square foot. 31 17th St is a home located in San Luis Obispo County.
Ownership History
Date
Name
Owned For
Owner Type
Purchase Details
Closed on
Jul 6, 2010
Sold by
Came Colette M
Bought by
Came Colette Mary
Current Estimated Value
Purchase Details
Closed on
May 24, 2010
Sold by
Came Mary
Bought by
Came Colette M
Purchase Details
Closed on
Jul 18, 2005
Sold by
Came Colette M
Bought by
Came Colette Mary
Purchase Details
Closed on
Dec 3, 1998
Sold by
Came Colette M
Bought by
Came Colette M
Home Financials for this Owner
Home Financials are based on the most recent Mortgage that was taken out on this home.
Original Mortgage
$193,600
Interest Rate
6.78%
Purchase Details
Closed on
Feb 8, 1995
Sold by
Came Colette M and Bodine Colette M
Bought by
Came Colette M
Create a Home Valuation Report for This Property
The Home Valuation Report is an in-depth analysis detailing your home's value as well as a comparison with similar homes in the area
Home Values in the Area
Average Home Value in this Area
Purchase History
| Date | Buyer | Sale Price | Title Company |
|---|---|---|---|
| Came Colette Mary | -- | None Available | |
| Came Colette M | -- | None Available | |
| Came Colette Mary | -- | -- | |
| Came Colette M | -- | Fidelity National Title Co | |
| Came Colette M | -- | -- |
Source: Public Records
Mortgage History
| Date | Status | Borrower | Loan Amount |
|---|---|---|---|
| Closed | Came Colette M | $193,600 |
Source: Public Records
Tax History
| Year | Tax Paid | Tax Assessment Tax Assessment Total Assessment is a certain percentage of the fair market value that is determined by local assessors to be the total taxable value of land and additions on the property. | Land | Improvement |
|---|---|---|---|---|
| 2025 | $2,655 | $252,726 | $101,207 | $151,519 |
| 2024 | $2,622 | $247,772 | $99,223 | $148,549 |
| 2023 | $2,622 | $242,915 | $97,278 | $145,637 |
| 2022 | $2,575 | $238,153 | $95,371 | $142,782 |
| 2021 | $2,532 | $233,484 | $93,501 | $139,983 |
| 2020 | $2,504 | $231,091 | $92,543 | $138,548 |
| 2019 | $2,454 | $226,561 | $90,729 | $135,832 |
| 2018 | $2,404 | $222,119 | $88,950 | $133,169 |
| 2017 | $2,353 | $217,764 | $87,206 | $130,558 |
| 2016 | $2,305 | $213,496 | $85,497 | $127,999 |
| 2015 | $2,283 | $210,290 | $84,213 | $126,077 |
| 2014 | $2,204 | $206,172 | $82,564 | $123,608 |
Source: Public Records
Map
Nearby Homes
- 1625 Cass Ave Unit 22
- 1234 Pacific Ave
- 2023 Circle Dr
- 96 24th St
- 29 11th St
- 0 California 1
- 0 Studio Dr
- 2651 Richard Ave
- 2670 Studio Dr
- 50 S 3rd St
- 31 N 3rd St
- 2712 Studio Dr
- 191 J St
- 2871 Studio Dr
- 2901 Ocean Blvd
- 2908 Orville Ave
- 0 Old Creek Rd Unit SC25189165
- 596 Hacienda Dr
- 1 Ramona Ave
- 0 Ramona Unit SC26017260
Your Personal Tour Guide
Ask me questions while you tour the home.