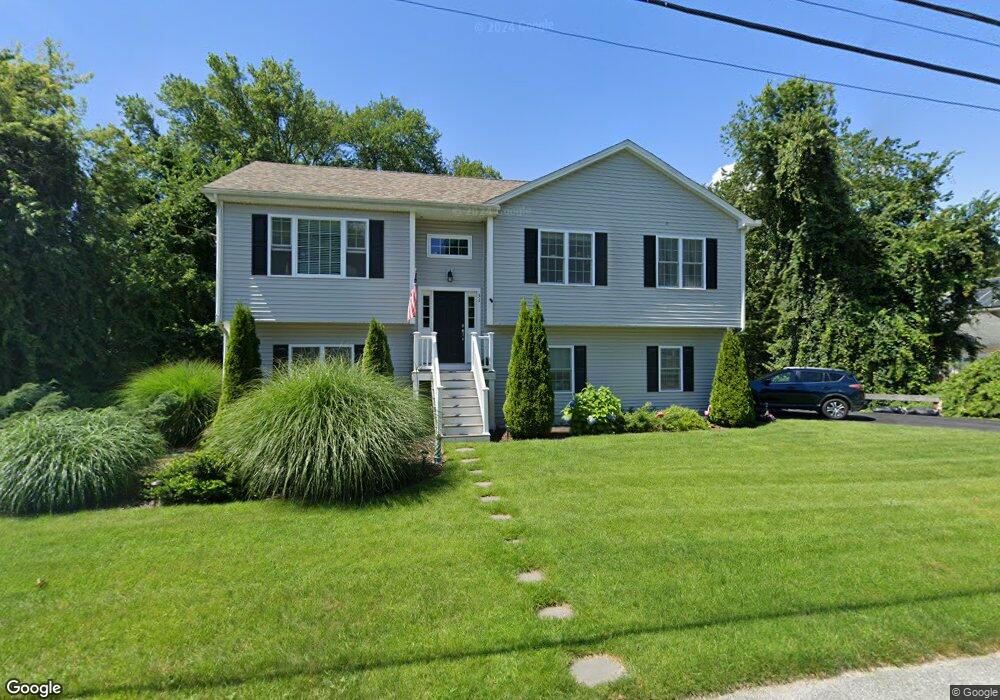
31 1st Ave Cumberland, RI 02864
Cumberland Hill NeighborhoodEstimated Value: $570,000 - $697,000
3
Beds
3
Baths
1,330
Sq Ft
$463/Sq Ft
Est. Value
About This Home
This home is located at 31 1st Ave, Cumberland, RI 02864 and is currently estimated at $615,513, approximately $462 per square foot. 31 1st Ave is a home located in Providence County with nearby schools including John J. McLaughlin Cumberland Hill School, North Cumberland Middle School, and Cumberland High School.
Ownership History
Date
Name
Owned For
Owner Type
Purchase Details
Closed on
Oct 28, 2016
Sold by
Smc Realty Llc
Bought by
Moreau Paul E
Current Estimated Value
Home Financials for this Owner
Home Financials are based on the most recent Mortgage that was taken out on this home.
Original Mortgage
$197,000
Outstanding Balance
$158,555
Interest Rate
3.5%
Mortgage Type
New Conventional
Estimated Equity
$456,958
Purchase Details
Closed on
Jun 12, 2015
Sold by
Almeida Juaquin S
Bought by
Smc Realty Llc
Home Financials for this Owner
Home Financials are based on the most recent Mortgage that was taken out on this home.
Original Mortgage
$48,309
Interest Rate
3.65%
Mortgage Type
New Conventional
Create a Home Valuation Report for This Property
The Home Valuation Report is an in-depth analysis detailing your home's value as well as a comparison with similar homes in the area
Home Values in the Area
Average Home Value in this Area
Purchase History
| Date | Buyer | Sale Price | Title Company |
|---|---|---|---|
| Moreau Paul E | $289,900 | -- | |
| Smc Realty Llc | $46,000 | -- |
Source: Public Records
Mortgage History
| Date | Status | Borrower | Loan Amount |
|---|---|---|---|
| Open | Smc Realty Llc | $197,000 | |
| Previous Owner | Smc Realty Llc | $48,309 |
Source: Public Records
Tax History Compared to Growth
Tax History
| Year | Tax Paid | Tax Assessment Tax Assessment Total Assessment is a certain percentage of the fair market value that is determined by local assessors to be the total taxable value of land and additions on the property. | Land | Improvement |
|---|---|---|---|---|
| 2025 | $5,623 | $458,300 | $161,000 | $297,300 |
| 2024 | $5,477 | $458,300 | $161,000 | $297,300 |
| 2023 | $5,325 | $458,300 | $161,000 | $297,300 |
| 2022 | $5,300 | $353,600 | $112,600 | $241,000 |
| 2021 | $5,212 | $353,600 | $112,600 | $241,000 |
| 2020 | $5,064 | $353,600 | $112,600 | $241,000 |
| 2019 | $5,039 | $317,300 | $94,000 | $223,300 |
| 2018 | $4,893 | $317,300 | $94,000 | $223,300 |
| 2017 | $5,164 | $339,500 | $94,000 | $245,500 |
| 2016 | $292 | $17,100 | $17,100 | $0 |
| 2015 | $292 | $17,100 | $17,100 | $0 |
| 2014 | -- | $17,100 | $17,100 | $0 |
| 2013 | $270 | $17,100 | $17,100 | $0 |
Source: Public Records
Map
Nearby Homes