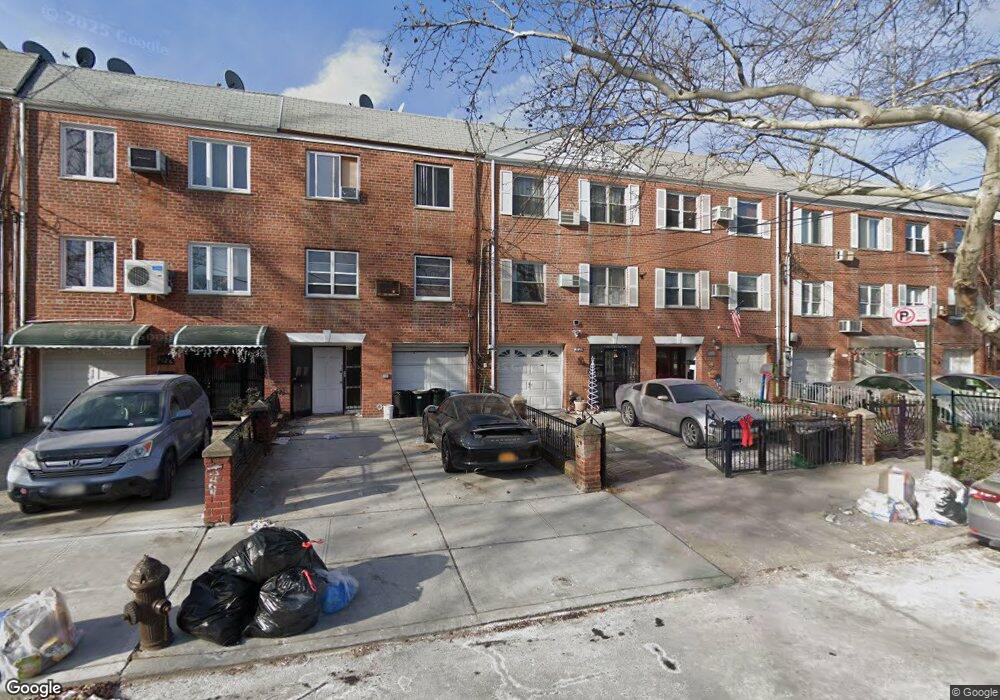
31-20 74th St Flushing, NY 11370
Jackson Heights NeighborhoodEstimated Value: $1,014,000 - $1,349,000
2
Beds
1
Bath
2,422
Sq Ft
$510/Sq Ft
Est. Value
About This Home
This home is located at 31-20 74th St, Flushing, NY 11370 and is currently estimated at $1,234,667, approximately $509 per square foot. 31-20 74th St is a home located in Queens County with nearby schools including Ps 152 Gwendolyn N Alleyne School, I.S. 230, and William Cullen Bryant High School.
Ownership History
Date
Name
Owned For
Owner Type
Purchase Details
Closed on
Jan 24, 2017
Sold by
Johal Gurbakhash and Singh Darshan
Bought by
Johal Gurbakhash and Singh Darshan
Current Estimated Value
Purchase Details
Closed on
Feb 5, 2015
Sold by
Johal Gurbakhash and Singh Darshan
Bought by
Johal Gurbakhash and Singh Darshan
Home Financials for this Owner
Home Financials are based on the most recent Mortgage that was taken out on this home.
Original Mortgage
$425,000
Interest Rate
3.74%
Mortgage Type
New Conventional
Purchase Details
Closed on
Mar 30, 2000
Sold by
Mutdhastira Yodhin and Arambulo Cora
Bought by
Singh Darshan and Johal Gurbakhash K
Home Financials for this Owner
Home Financials are based on the most recent Mortgage that was taken out on this home.
Original Mortgage
$232,000
Interest Rate
8.21%
Mortgage Type
Purchase Money Mortgage
Create a Home Valuation Report for This Property
The Home Valuation Report is an in-depth analysis detailing your home's value as well as a comparison with similar homes in the area
Home Values in the Area
Average Home Value in this Area
Purchase History
| Date | Buyer | Sale Price | Title Company |
|---|---|---|---|
| Johal Gurbakhash | -- | -- | |
| Johal Gurbakhash | -- | -- | |
| Singh Darshan | $290,000 | Stewart Title |
Source: Public Records
Mortgage History
| Date | Status | Borrower | Loan Amount |
|---|---|---|---|
| Previous Owner | Johal Gurbakhash | $425,000 | |
| Previous Owner | Singh Darshan | $232,000 |
Source: Public Records
Tax History Compared to Growth
Tax History
| Year | Tax Paid | Tax Assessment Tax Assessment Total Assessment is a certain percentage of the fair market value that is determined by local assessors to be the total taxable value of land and additions on the property. | Land | Improvement |
|---|---|---|---|---|
| 2025 | $4,677 | $57,418 | $7,249 | $50,169 |
| 2024 | $4,781 | $54,168 | $7,758 | $46,410 |
| 2023 | $4,369 | $51,102 | $6,974 | $44,128 |
| 2022 | $4,525 | $63,720 | $9,900 | $53,820 |
| 2021 | $4,777 | $62,700 | $9,900 | $52,800 |
| 2020 | $9,832 | $65,880 | $9,900 | $55,980 |
| 2019 | $9,150 | $60,660 | $9,900 | $50,760 |
| 2018 | $8,383 | $42,585 | $7,126 | $35,459 |
| 2017 | $7,890 | $40,176 | $7,349 | $32,827 |
| 2016 | $7,722 | $40,176 | $7,349 | $32,827 |
| 2015 | $4,352 | $39,874 | $9,391 | $30,483 |
| 2014 | $4,352 | $37,617 | $10,153 | $27,464 |
Source: Public Records
Map
Nearby Homes