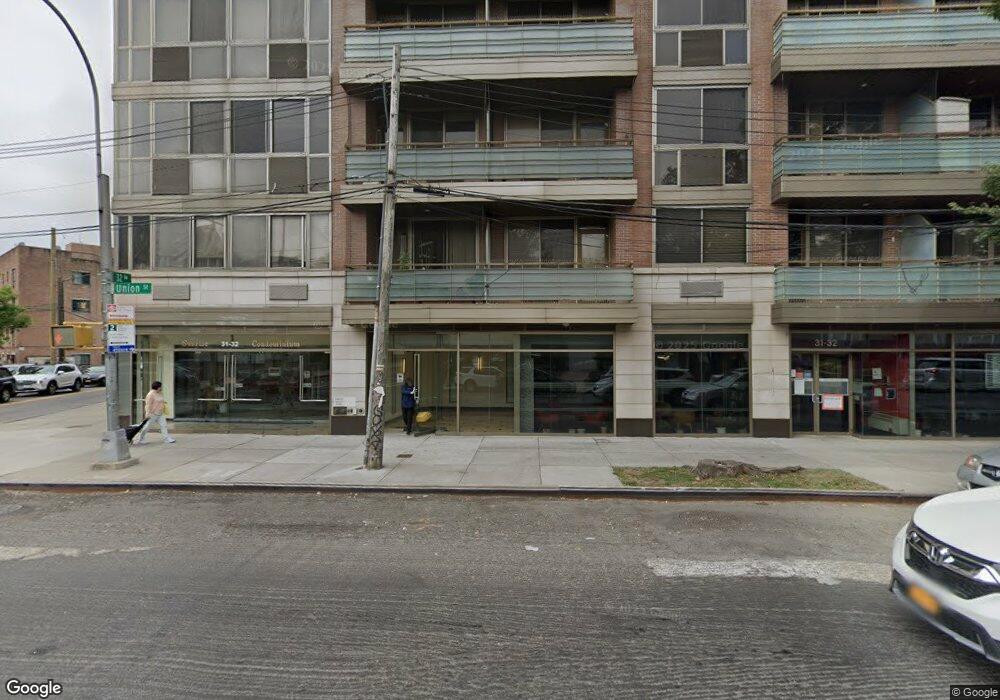
31-32 Union St Unit 2H Flushing, NY 11354
Flushing-Willets Point NeighborhoodEstimated Value: $727,000 - $808,000
2
Beds
2
Baths
1,026
Sq Ft
$738/Sq Ft
Est. Value
About This Home
This home is located at 31-32 Union St Unit 2H, Flushing, NY 11354 and is currently estimated at $756,798, approximately $737 per square foot. 31-32 Union St Unit 2H is a home located in Queens County with nearby schools including P.S. 214 Cadwallader Colden, Jhs 185 Edward Bleeker, and Flushing High School.
Ownership History
Date
Name
Owned For
Owner Type
Purchase Details
Closed on
Jan 25, 2018
Sold by
Lin Jing and Wang Jack Jiang
Bought by
Ruozhen Li
Current Estimated Value
Home Financials for this Owner
Home Financials are based on the most recent Mortgage that was taken out on this home.
Original Mortgage
$564,800
Outstanding Balance
$476,125
Interest Rate
3.99%
Mortgage Type
New Conventional
Estimated Equity
$280,673
Purchase Details
Closed on
Oct 22, 2015
Sold by
Jeon Choonok and Law Office Of Yu Mi Hong
Bought by
Lin Ling and Wang Jack Jiang
Purchase Details
Closed on
Mar 20, 2013
Sold by
Kim Soon H and Song Yong C
Bought by
Jeon Choonok and Kim Soon H
Purchase Details
Closed on
Dec 8, 2008
Sold by
Paramount Management Corp
Bought by
Kim Soon Hee and Song Yong C
Home Financials for this Owner
Home Financials are based on the most recent Mortgage that was taken out on this home.
Original Mortgage
$337,500
Interest Rate
6.27%
Mortgage Type
Purchase Money Mortgage
Create a Home Valuation Report for This Property
The Home Valuation Report is an in-depth analysis detailing your home's value as well as a comparison with similar homes in the area
Home Values in the Area
Average Home Value in this Area
Purchase History
| Date | Buyer | Sale Price | Title Company |
|---|---|---|---|
| Ruozhen Li | $706,000 | -- | |
| Ruozhen Li | $706,000 | -- | |
| Lin Ling | $557,000 | -- | |
| Lin Ling | $557,000 | -- | |
| Jeon Choonok | $160,000 | -- | |
| Jeon Choonok | $160,000 | -- | |
| Kim Soon Hee | $450,000 | -- | |
| Kim Soon Hee | $450,000 | -- |
Source: Public Records
Mortgage History
| Date | Status | Borrower | Loan Amount |
|---|---|---|---|
| Open | Ruozhen Li | $564,800 | |
| Closed | Ruozhen Li | $564,800 | |
| Previous Owner | Kim Soon Hee | $337,500 |
Source: Public Records
Tax History
| Year | Tax Paid | Tax Assessment Tax Assessment Total Assessment is a certain percentage of the fair market value that is determined by local assessors to be the total taxable value of land and additions on the property. | Land | Improvement |
|---|---|---|---|---|
| 2025 | $10,603 | $84,689 | $15,958 | $68,731 |
| 2024 | $10,603 | $84,809 | $15,958 | $68,851 |
| 2023 | $8,632 | $85,913 | $15,958 | $69,955 |
| 2022 | $6,191 | $88,637 | $15,958 | $72,679 |
| 2021 | $3,856 | $76,230 | $15,958 | $60,272 |
| 2020 | $2,057 | $87,594 | $15,958 | $71,636 |
| 2019 | $197 | $86,522 | $15,958 | $70,564 |
| 2018 | $199 | $67,513 | $15,958 | $51,555 |
| 2017 | $199 | $71,086 | $15,958 | $55,128 |
| 2016 | $202 | $71,086 | $15,958 | $55,128 |
| 2015 | -- | $65,965 | $15,958 | $50,007 |
| 2014 | -- | $64,781 | $15,958 | $48,823 |
Source: Public Records
Map
Nearby Homes
- 3132 Union St Unit 2C
- 31-22 Union St Unit 2D
- 140-21 32nd Ave Unit 6An
- 140-21 32nd Ave Unit 2 FN
- 140-21 32nd Ave Unit 5Cn
- 14021 32nd Ave Unit 5CN
- 3029 143rd St
- 140-03 32nd Ave
- 31-90 140th St Unit 2B
- 14018 33rd Ave Unit 104
- 13825 31st Dr Unit 2
- 138-25 31st Dr Unit 2
- 138-25 31st Dr Unit 6L
- 140-21 31st Rd Unit 4A
- 140-21 31st Rd Unit 2A
- 139-19 34th Ave
- 13909 34th Ave
- 13911 34th Ave
- 146-43 Bayside Ave
- 13907 34th Ave
- 31-32 Union St Unit 2A
- 31-32 Union St Unit 4H
- 31-32 Union St Unit 3D
- 31-32 Union St Unit 2B
- 31-32 Union St Unit 5A
- 31-32 Union St Unit 5E
- 31-32 Union St Unit 2C
- 31-32 Union St Unit 3B
- 31-32 Union St Unit 5C
- 31-32 Union St Unit 3C
- 31-32 Union St Unit 3H
- 31-32 Union St Unit 5H
- 31-32 Union St Unit 3g
- 31-32 Union St Unit 4
- 31-32 Union St Unit 4th FL
- 31-32 Union St Unit 2F
- 31-32 Union St Unit 4F
- 31-32 Union St Unit 3F
- 31-32 Union St Unit 5 F
- 31-32 Union St Unit 5D
Your Personal Tour Guide
Ask me questions while you tour the home.