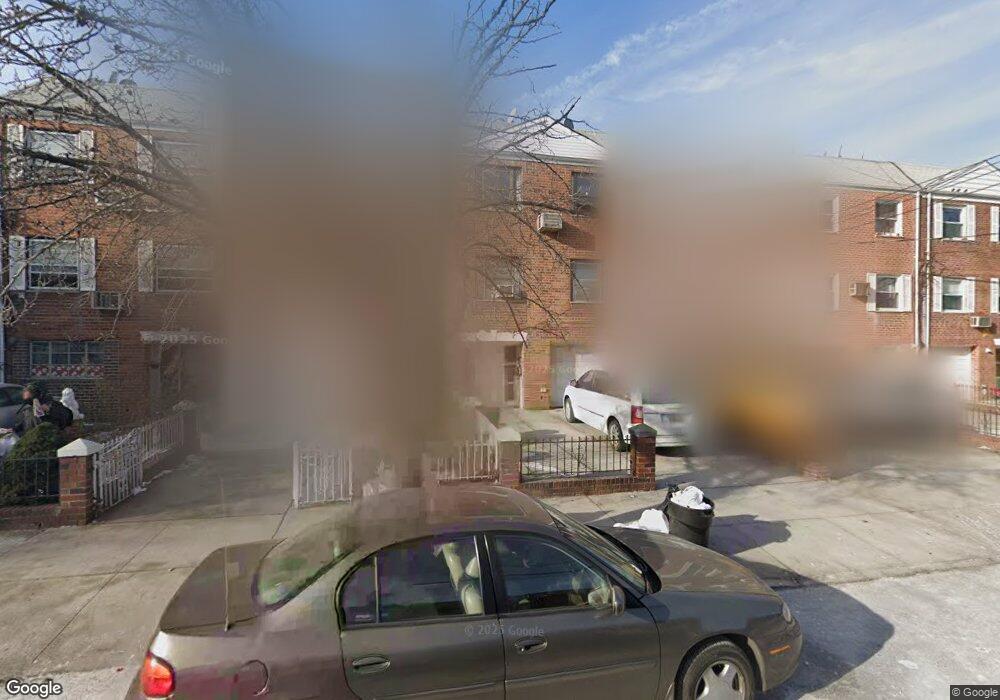
31-34 74th St Flushing, NY 11370
Jackson Heights NeighborhoodEstimated Value: $1,204,000 - $1,344,000
3
Beds
2
Baths
2,622
Sq Ft
$477/Sq Ft
Est. Value
About This Home
This home is located at 31-34 74th St, Flushing, NY 11370 and is currently estimated at $1,249,993, approximately $476 per square foot. 31-34 74th St is a home located in Queens County with nearby schools including Ps 152 Gwendolyn N Alleyne School, I.S. 230, and William Cullen Bryant High School.
Ownership History
Date
Name
Owned For
Owner Type
Purchase Details
Closed on
Sep 27, 2013
Sold by
Singh Davinder and Singh Kulwinder K
Bought by
Kumar Arvind
Current Estimated Value
Home Financials for this Owner
Home Financials are based on the most recent Mortgage that was taken out on this home.
Original Mortgage
$480,350
Outstanding Balance
$361,366
Interest Rate
4.53%
Estimated Equity
$888,627
Purchase Details
Closed on
Aug 29, 2003
Sold by
Din Lal
Bought by
Singh Kulwinder K
Home Financials for this Owner
Home Financials are based on the most recent Mortgage that was taken out on this home.
Original Mortgage
$360,000
Interest Rate
6.09%
Mortgage Type
Purchase Money Mortgage
Purchase Details
Closed on
Feb 9, 2000
Sold by
Vitellas Stefanos and Vitellas Maria
Bought by
Din Lal
Home Financials for this Owner
Home Financials are based on the most recent Mortgage that was taken out on this home.
Original Mortgage
$256,000
Interest Rate
8%
Create a Home Valuation Report for This Property
The Home Valuation Report is an in-depth analysis detailing your home's value as well as a comparison with similar homes in the area
Home Values in the Area
Average Home Value in this Area
Purchase History
| Date | Buyer | Sale Price | Title Company |
|---|---|---|---|
| Kumar Arvind | $739,000 | -- | |
| Singh Kulwinder K | $600,000 | -- | |
| Din Lal | $320,000 | -- |
Source: Public Records
Mortgage History
| Date | Status | Borrower | Loan Amount |
|---|---|---|---|
| Open | Kumar Arvind | $480,350 | |
| Previous Owner | Singh Kulwinder K | $360,000 | |
| Previous Owner | Din Lal | $256,000 |
Source: Public Records
Tax History Compared to Growth
Tax History
| Year | Tax Paid | Tax Assessment Tax Assessment Total Assessment is a certain percentage of the fair market value that is determined by local assessors to be the total taxable value of land and additions on the property. | Land | Improvement |
|---|---|---|---|---|
| 2025 | $11,019 | $58,156 | $7,472 | $50,684 |
| 2024 | $11,019 | $54,864 | $7,239 | $47,625 |
| 2023 | $10,412 | $51,840 | $6,405 | $45,435 |
| 2022 | $10,349 | $79,560 | $10,260 | $69,300 |
| 2021 | $10,811 | $71,880 | $10,260 | $61,620 |
| 2020 | $10,258 | $69,120 | $10,260 | $58,860 |
| 2019 | $9,564 | $69,000 | $10,260 | $58,740 |
| 2018 | $8,806 | $43,200 | $7,402 | $35,798 |
| 2017 | $8,806 | $43,200 | $7,977 | $35,223 |
| 2016 | $8,558 | $43,200 | $7,977 | $35,223 |
| 2015 | $5,325 | $40,386 | $10,070 | $30,316 |
| 2014 | $5,325 | $38,100 | $11,400 | $26,700 |
Source: Public Records
Map
Nearby Homes
- 32-24 75th St
- 32-31 71st St
- 32-23 76th St
- 31-32 77th St
- 31-14 77th St
- 32-50 77th St
- 69-20 31st Ave
- 33-17 72nd St
- 3005 72nd St
- 33-31 74th St
- 78-10 32nd Ave
- 32-47 78th St
- 31-39 68th St
- 32-59 78th St
- 25-45 72nd St
- 30-30 78th St
- 72-17 34th Ave Unit 6D
- 72-17 34th Ave Unit 4J
- 72-17 34th Ave Unit 1H
- 72-17 34th Ave Unit 1P