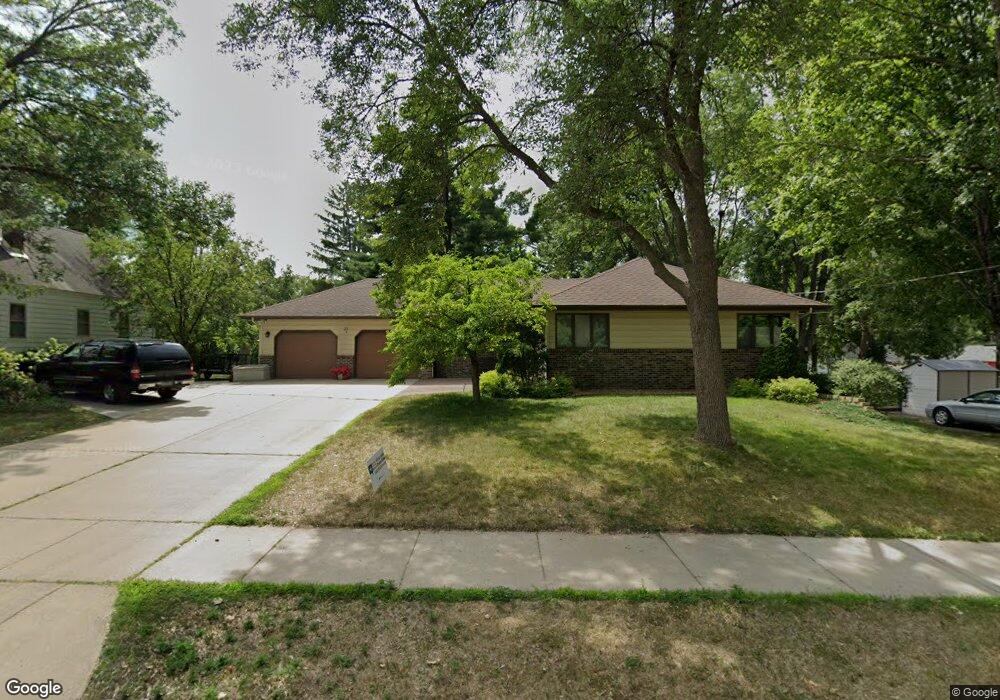
31 6th Ave S Sauk Rapids, MN 56379
Estimated Value: $303,234 - $324,000
3
Beds
2
Baths
1,644
Sq Ft
$191/Sq Ft
Est. Value
About This Home
This home is located at 31 6th Ave S, Sauk Rapids, MN 56379 and is currently estimated at $313,559, approximately $190 per square foot. 31 6th Ave S is a home located in Benton County with nearby schools including Mississippi Heights Elementary School, Sauk Rapids-Rice Middle School, and Sauk Rapids-Rice Senior High School.
Ownership History
Date
Name
Owned For
Owner Type
Purchase Details
Closed on
Dec 4, 2017
Sold by
Swanson James and Swanson Judith
Bought by
Swanson John R and Swanson Viki L
Current Estimated Value
Purchase Details
Closed on
Oct 30, 2009
Sold by
Skillingstad Janet A
Bought by
Swanson James and Swanson Judith
Home Financials for this Owner
Home Financials are based on the most recent Mortgage that was taken out on this home.
Original Mortgage
$65,000
Interest Rate
5.05%
Mortgage Type
New Conventional
Create a Home Valuation Report for This Property
The Home Valuation Report is an in-depth analysis detailing your home's value as well as a comparison with similar homes in the area
Home Values in the Area
Average Home Value in this Area
Purchase History
| Date | Buyer | Sale Price | Title Company |
|---|---|---|---|
| Swanson John R | $299,650 | None Available | |
| Swanson James | $162,000 | -- |
Source: Public Records
Mortgage History
| Date | Status | Borrower | Loan Amount |
|---|---|---|---|
| Previous Owner | Swanson James | $65,000 |
Source: Public Records
Tax History Compared to Growth
Tax History
| Year | Tax Paid | Tax Assessment Tax Assessment Total Assessment is a certain percentage of the fair market value that is determined by local assessors to be the total taxable value of land and additions on the property. | Land | Improvement |
|---|---|---|---|---|
| 2025 | $1,966 | $317,700 | $30,700 | $287,000 |
| 2024 | $1,826 | $301,700 | $30,700 | $271,000 |
| 2023 | $1,504 | $299,200 | $30,700 | $268,500 |
| 2022 | $1,120 | $261,400 | $27,900 | $233,500 |
| 2021 | $868 | $224,700 | $27,900 | $196,800 |
| 2018 | $2,218 | $29,400 | $4,392 | $25,008 |
| 2017 | $2,218 | $8,300 | $1,405 | $6,895 |
| 2016 | $2,152 | $153,800 | $26,800 | $127,000 |
| 2015 | $2,172 | $119,300 | $22,265 | $97,035 |
| 2014 | -- | $112,900 | $21,973 | $90,927 |
| 2013 | -- | $114,500 | $22,045 | $92,455 |
Source: Public Records
Map
Nearby Homes
- 117 6th Ave N
- 112 Summit Ave S
- 216 8th Ave N
- 100 9th Ave S
- 615 3rd Ave N
- 608 Summit Ave S
- 1804 8th Ave S
- 1803 8th Ave S
- 224 9th St N
- 1021 5th St S
- 1 Skyview Dr
- 2021 Hillcrest Dr
- 1101 10th Ave N
- 1107 10th Ave N
- 1105 Summit Ave N
- 3300 321st St
- 3322 321st St
- 880 Golden Spike Rd NE
- 1201 10th Ave N
- 2161 Mill Pond Dr